How much should your SaaS startup spend on sales and marketing? I’ve written about using unit economics and lead funnel performance to answer this question. Emulating the patterns of successful SaaS companies is another technique.
There are about 34 publicly traded SaaS companies that have published their revenue and sales & marketing expenses. Though their revenue growth rates are each unique, the sales and marketing spend patterns are quite similar.
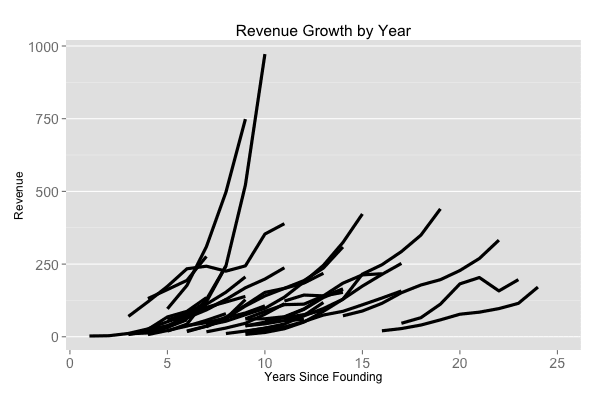The revenue ramps of public SaaS companies follow the familiar exponential growth path. But their rates of growth vary quite a bit. Some companies' revenue ramps are more pronounced than others. LinkedIn is the most vertical of these, reaching nearly $1B of revenue in 10 years while Kenexa and Vocus needed 25 years to reach $200M-$300M in revenue.
Despite these varied revenue trends, the sales and marketing spends as a fraction of revenue are remarkably similar. The chart below depicts Sales and Marketing Spend by Year / Revenue for each company. There seems to be a pattern.
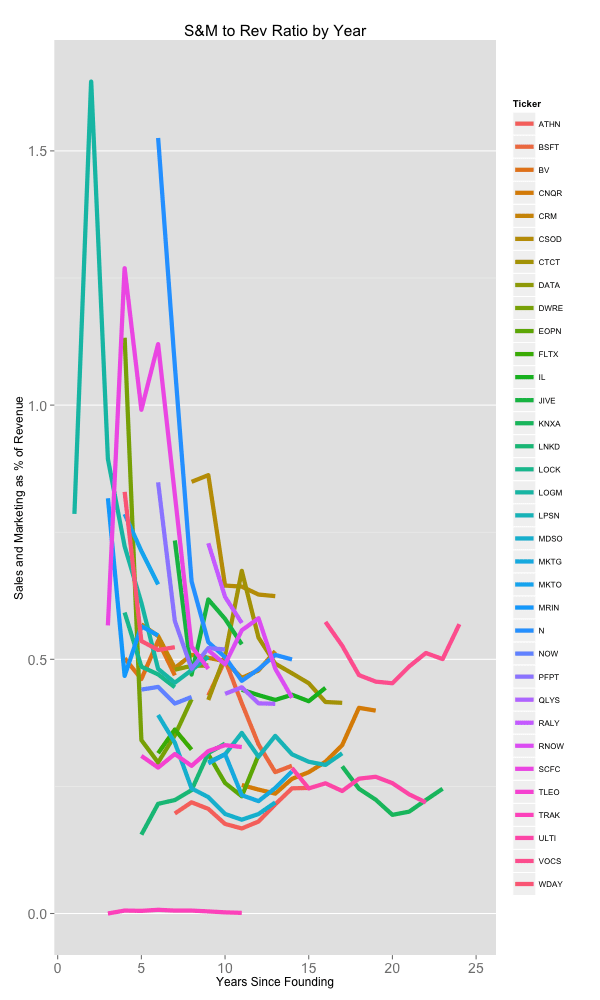Running a smoothing algorithm over the data reveals the trend.
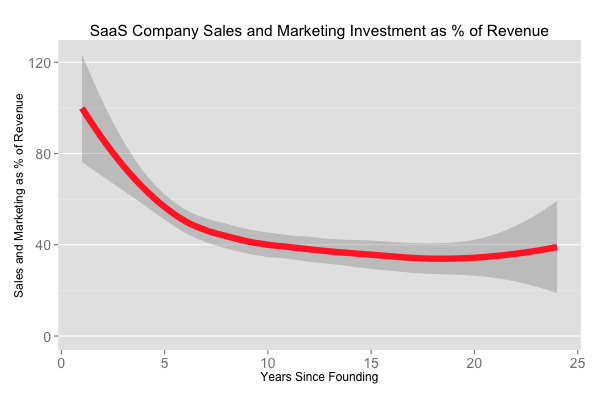In the first 3 years, these public SaaS companies spend between 80 to 120% of their revenue in sales and marketing (using venture dollars or other forms of capital to finance the business). By year 5, that ratio has fallen to about 50% where it remains for the life of the business.
Despite the divergent revenue ramps, the marketing and sales spend patterns for these companies resemble each other strongly and serve as good benchmarks for high-growth SaaS startups.
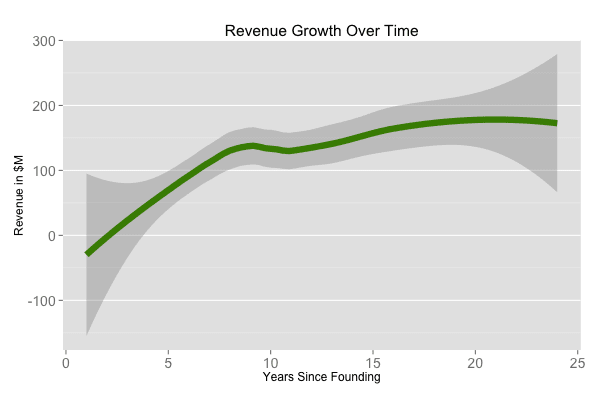
In case you’re curious, below is the “typical” revenue growth trajectory for these SaaS companies: $50M in year five, $100M in year ten.
Notes on the analysis:
Clearly, survivorship biases the data significantly.
Small sample sizes (n=30) mean the variance in the data is high.