3 minute read / Nov 11, 2013 /
The Ratio of Engineers to Sales People in Billion Dollar SaaS Startups
Constrained by a limited budget while seeking to grow as quickly as possible, startup founders must decide how to balance growing their engineering teams with their sales & marketing teams. To help inform those decisions, I’ve benchmarked the relative sizes of the sales and engineering teams of the 36 publicly-traded SaaS companies from founding to IPO, typically 7 years later.
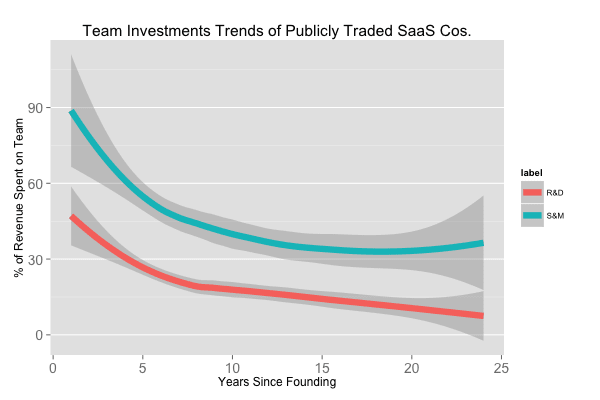
The graph above shows the average Sales & Marketing allocation in turquoise and Research & Development investment in red. In the early years of these startups, sales and marketing salaries consumed about 90% of revenues and slowly fell to 45%. Engineering commanded 50% of revenue, which also declined over time as revenue increased and more of that revenue was harvested as profit or re-invested elsewhere in the business.
The average founding team tends to be 2 people, one of whom is an engineer. When a company is founded, the sales/marketing to engineer ratio is 1:1. After the first year, this ratio for the public SaaS companies increases to 2:1 (S&M:R&D) for the life of the company.
| Year Since Founding | 1 | 2 | 3 | 4 | 5 | 6 | 7 |
|---|---|---|---|---|---|---|---|
| Median Revenue in $M | 2.6 | 3.5 | 11.3 | 25.2 | 55.2 | 69.6 | 98.1 |
| Sales : Eng Ratio | 1.5 | 3.5 | 2.0 | 1.7 | 1.9 | 2.4 | 2.1 |
| Sample Size | 1 | 1 | 5 | 9 | 12 | 16 | 18 |
This table above shows the data in a bit more detail including the sample size for each year. Only LogMeIn provided data in their S-1 about the first two years after founding, so the quality of the data there is questionable, but not wildly inaccurate from my experience.
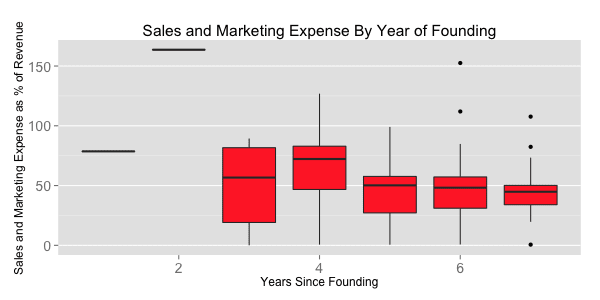
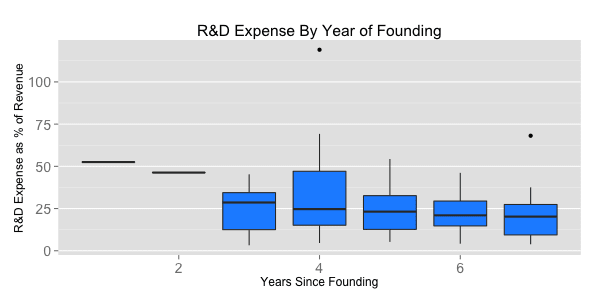
For those seeking even more detail, box plots below show the distribution for Sales & Marketing and Research & Development. They tell a similar story, but expose the variance across companies.
Notes about the Analysis
First, these ratios aren’t a recipe for success, just data to inform decisions. Each business is different because of the industry they serve, the go-to-market strategy and the particularities of their customers acquisition processes.
Second, the sales and marketing spend used in these calculations is the one provided by these companies in their S-1s and 10-ks, which includes all media purchasing, event budgets and other marketing spend. None of these startups break out marketing spend in their financial statements. But typically, somewhere around 15% of total revenue is spent on marketing and PR and my rough estimate of media spend is 7% of total revenue, which would decrease the S&M/R&D ratios by about 15% from those listed above.
Third, these companies lump all engineering spend together, so the same is true for research and development. I’m assuming all R&D for these businesses is product development, even if a SaaS company management team decides it is prudent to develop a drone program or another project othogonal to the current business.