Churn is one of the most important metrics for businesses. Churn dictates customer lifetime, lifetime value (CLV), customer acquisition spend and customer success spending. In short, churn is pivotal number to evaluate a startup’s business, both for founders/management teams and investors.
Unfortunately, accurately measuring churn rates/lifetime value is more complex than I initially thought. I was researching the topic after Ryan Shank asked me how best to calculate an average customer’s lifetime value. The more I dug into the math, the deeper the rabbit hole went.
Most companies calculate lifetime value with this formula:
monthly_revenue x 1/monthly_churn_rate
And that formula makes sense as this Snowplow presentation explains and this Wikipedia on geometric series entry shows. The problem is there are three major assumptions in the formula:
- The churn rate from month to month is consistent
- The churn rate from customer to customer is consistent
- The business’s offering is consistent (pricing, competitive dynamics)
None of these hold true for most businesses. In practice, Custora found LTV estimates can be more than 2x greater than reality.
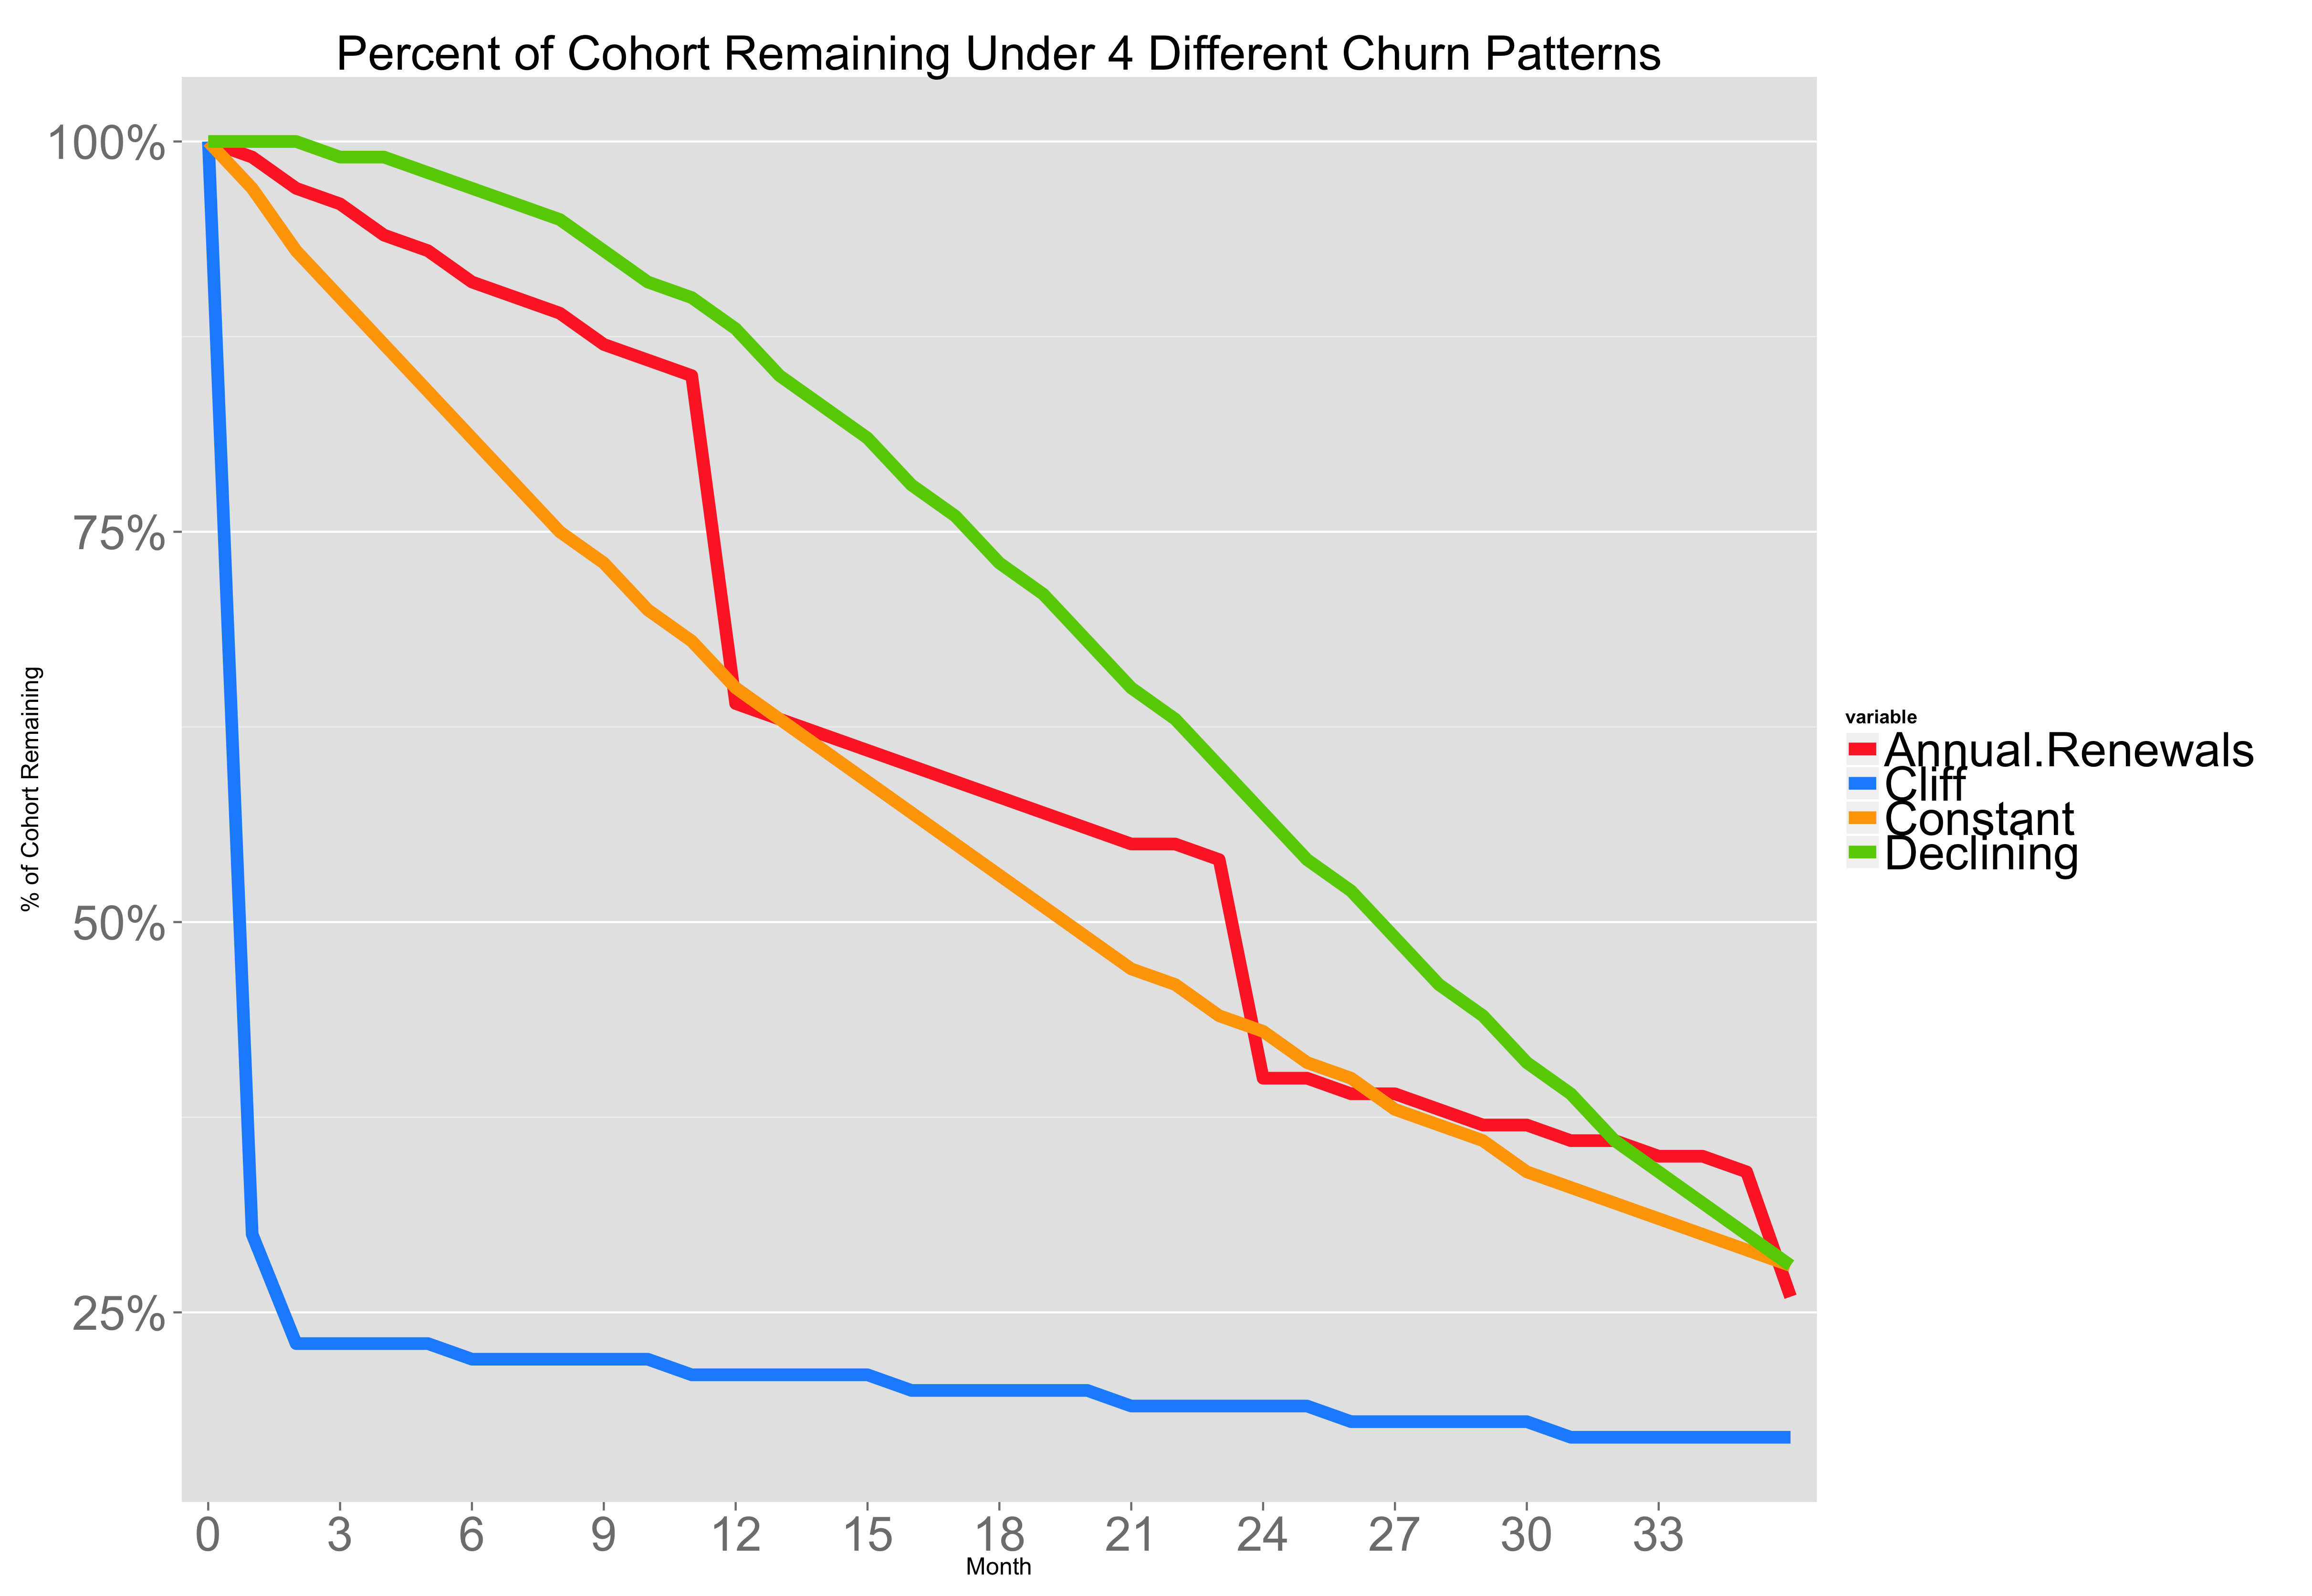
Let’s look at why this happens. I’ve modeled four different types of customer retention curves below, each with the same 3.5% average monthly churn, but with wildly different customer behaviors. I’ve seen businesses with all four types of churn characteristics from gaming companies to SaaS companies to ecommerce subscription companies.
Annual Renewals: 1.5% of these customers churn each month and at each 12 month period, when it’s time to renew a big contract, another 25% churn.
Cliff: in the first month, 70% of customers churn. In the second month, 22% of customers churn. Then only 1% of customers churn each month.
Constant: a steady 3.5% monthly churn per month.
Declining: churn starts at zero and increases 0.25% each month.
Below is a chart showing the percentage of a cohort retained over time under each model. Click to enlarge it.
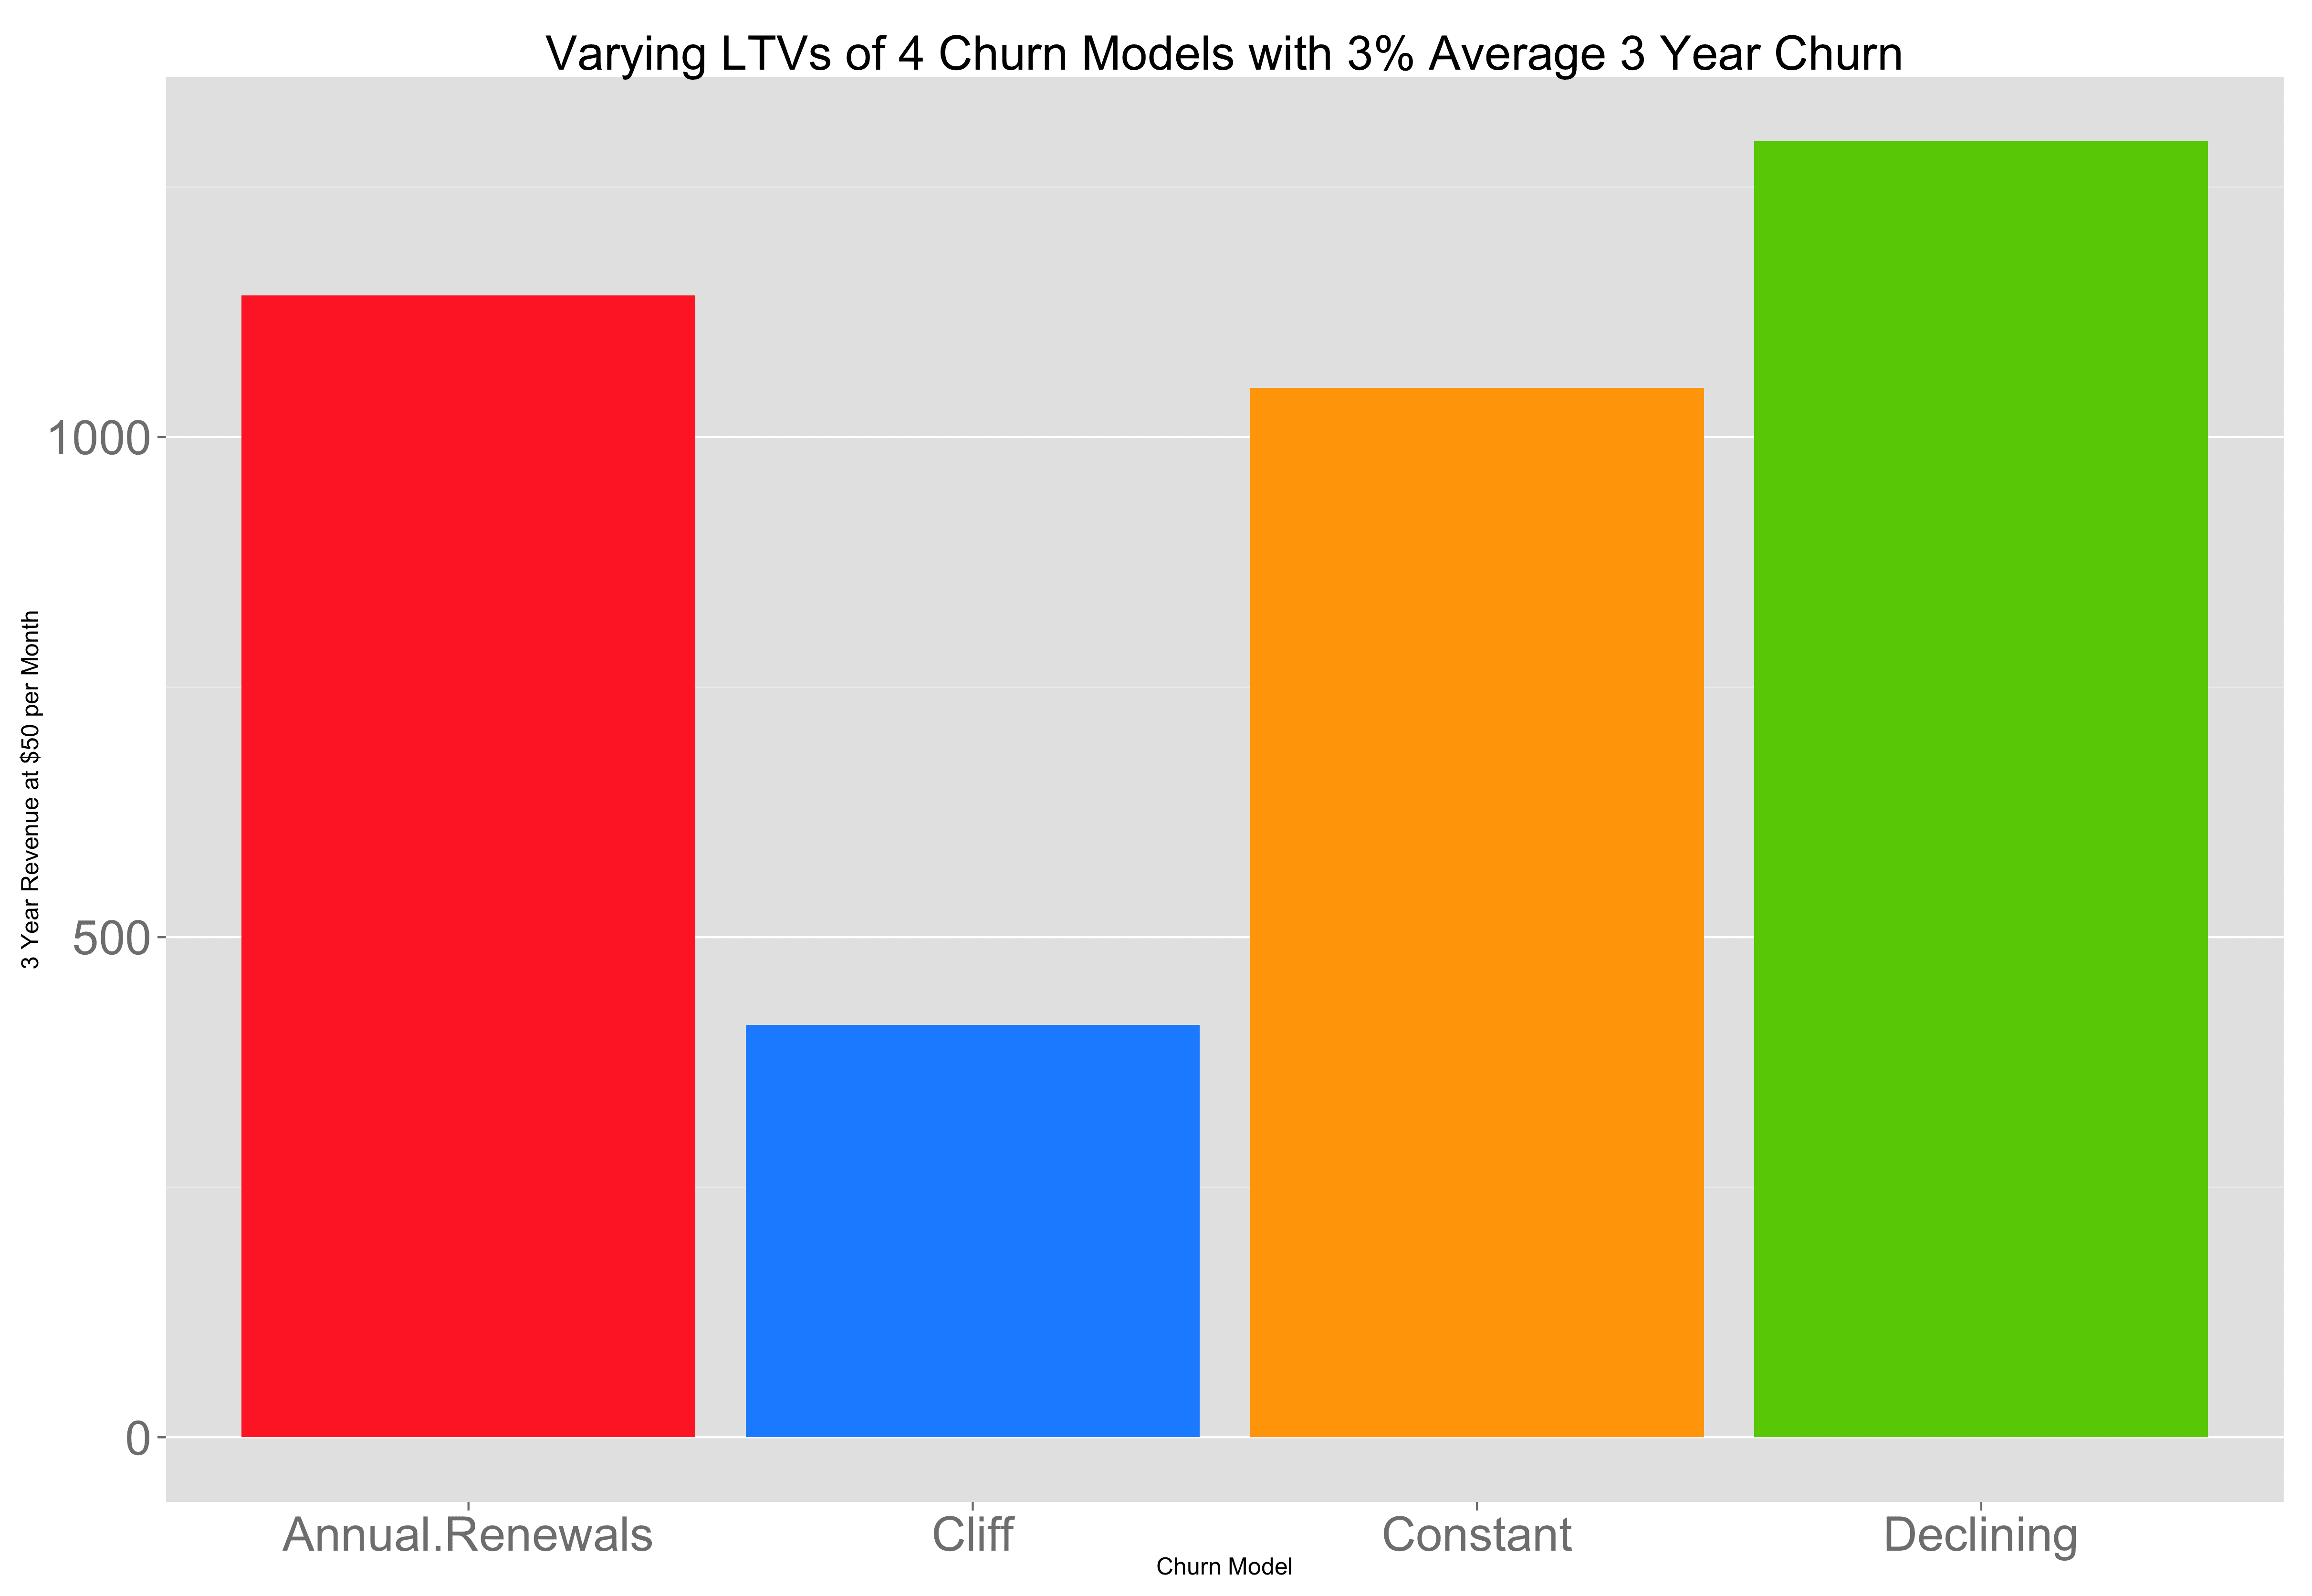
But here’s the money graph: the customer lifetime value under each of the models assuming a $50 per month fee for across 3 years. The three models are relatively consistent and vary by about 25%. The last one, the cliff, is 75% lower.
Given all this variance, if you’re looking for a simple way of calculating LTV more conservatively, you might change the formula above to
monthly_revenue x 1/monthly_churn_rate x 0.75
and haircut the estimate by 25% or 30%. A slightly better approach would be to perform this analysis by customer segment. First it requires understanding the customer base and their behaviors. How many segments in the customer base exist? What is each customer segment’s churn curve (are they cliff customers or constant customers? And what fraction of does each segment represent?
But, as the Custora data shows, the best way to calculate churn requires a lot more math, using Bayesian modeling. There are some great papers explaining this approach, like this one from UCLA.
Churn rates and LTV are challenging to predict with accuracy and while rules of thumb like the formulas above may be reasonable guidelines, it’s important to be aware of their tendency to overestimate lifetime value, as Jason Cohen explains here. Because a 2x overestimate of customer lifetime can radically change a startup’s unit economics, deeply understanding churn behaviors is crucial to making a startup’s business model viable.