What should the optimal revenue per customer be for a SaaS company? I could say million dollar contracts typical of enterprise sales provide more long-term stability and total revenue opportunity. On the other hand I might contend larger customer bases paying smaller license fees enable more predictable growth. Which is the correct argument?
First, lets examine the relationship between average customer value and total revenues, to see if smaller customers create a glass ceiling for total revenue. Below are two charts of data from venture-backed SaaS IPOs from 2010 to 2014. The chart on the left shows the average revenue per customer in $k at the time the company filed their S-1. The chart on the right shows the startup’s trailing twelve months’ revenue at the time of their S-1.
Click for larger images. Tabular data is here.
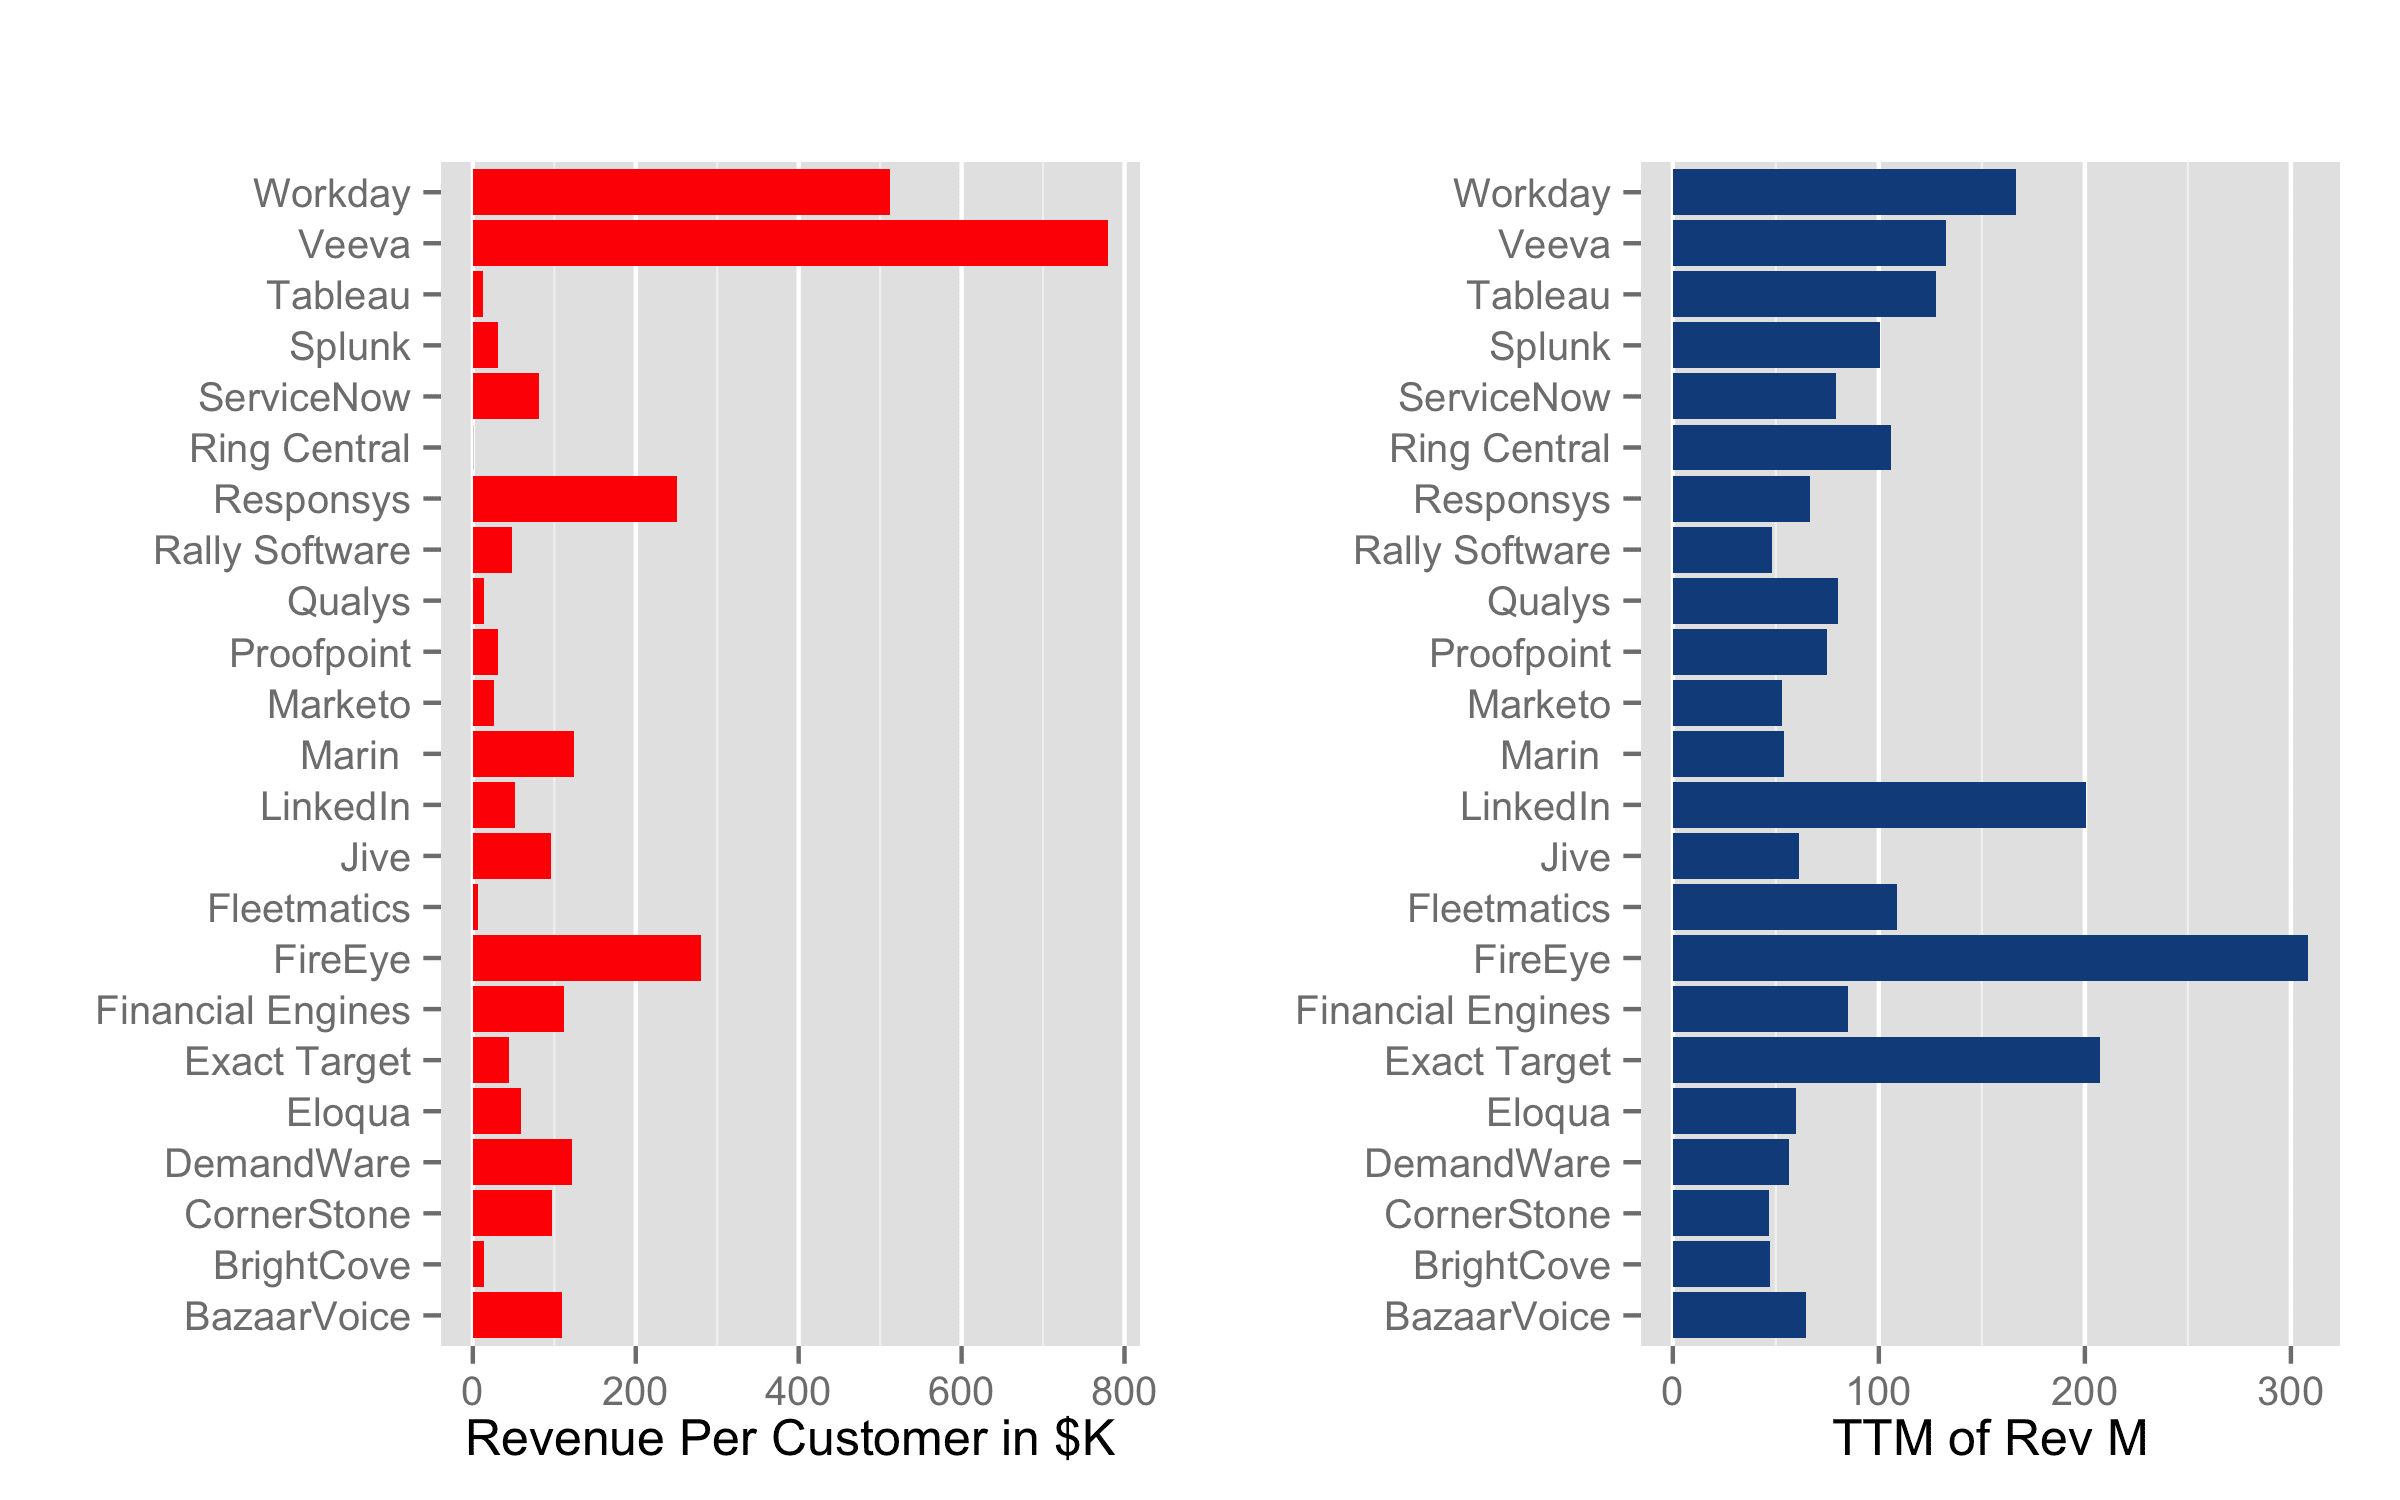
It’s clear that only a very weak relationship exists between the revenue per customer and total revenues. The small correlation between the two variables proves the point: R^2 is 0.3. In other words, entrepreneurs have built very large revenue companies with hundreds of thousands of small customers (Ring Central), a moderate number of medium sized customers (LinkedIn) and a small number of large customers (Veeva).
In addition to revenue potential, we should consider the impact of average customer value on market capitalization/company value. Below, the box plot depicts the distribution of market capitalization broken down by the four quartiles of ACV: $30k, $75k, $125k and $2M+ in average annual revenue per customer.

Across the first three quartiles, the median market cap is identical. For these companies, the average customer value has very little impact on market cap. The $75k quartile has an upward bias in its distribution compared to the $30k and the $125k quartiles, an aberration caused by LinkedIn’s massive success selling $50k average annual licenses to about 4,000 customers at the time of the S-1.
At first blush, the $2M quartile companies seem to garner 3x larger market caps. But, the table below shows this is a false conclusion. The $2M quartile companies wait to IPO until they generate 2 to 3x the trailing twelve months (TTM) revenue of the three smaller quartiles. Therefore, the difference in market cap multiples across quartiles isn’t substantial. Fourth quartile companies may delay their IPOs to assuage public market investors’ concerns about substantially higher customer concentration risk, since the total number of customers is in the low-hundreds.
| ACV Quartile | Mean MC in $M | Median MC in $M | Average # of Customers | Median TTM Revenue in $M |
|---|---|---|---|---|
| <$30k | 1,763 | 1,510 | 56,166 | 93 |
| <$75k | 6,348 | 1,875 | 2,717 | 88 |
| <$125k | 2,650 | 2,240 | 619 | 61 |
| <$2M | 7,363 | 6,150 | 465 | 150 |
For some time, I’ve been wondering whether companies selling enteprise software contracts with long sales cycles are less attractive to investors than newer SaaS companies with high-velocity, low friction sales models. After all, this newer, high-velocity model provides much more predictability in sales processes. But the data indicates this isn’t the case. There is no optimal ACV to maximize for market cap or revenues, according to this data. Multi-billion dollar SaaS companies can be built serving customers, large or small.