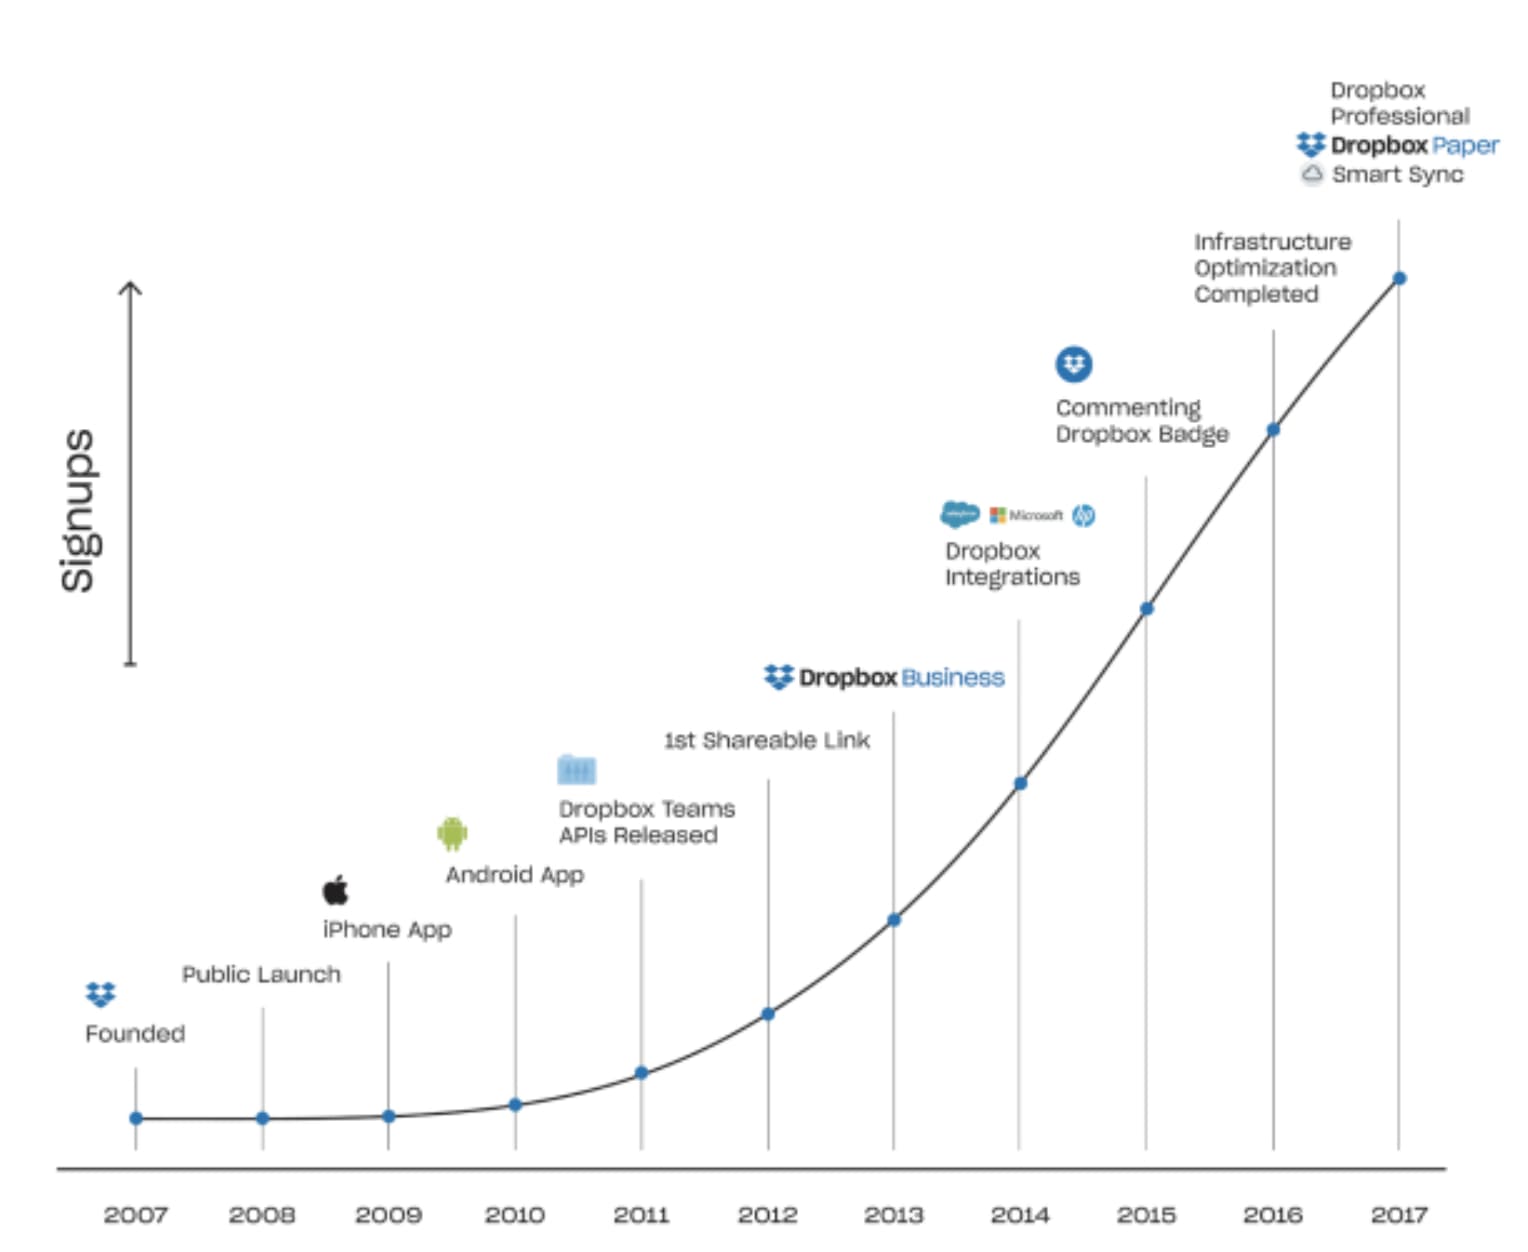
Founded in 2007, Dropbox epitomizes the freemium go-to-market. Dropbox has grown from 0 to 500 million users over that time period. 2% of those users convert to paid and pay an average of $9.33 per month. 90% of revenue originates through self serve channels - an astounding figure for company that generated more than $1B in revenue last year.
) " width=“500px”/>
" width=“500px”/>Dropbox’s revenue grew from $604M to $1.1B from 2015 to 2017, a compound annual growth rate of 35%.
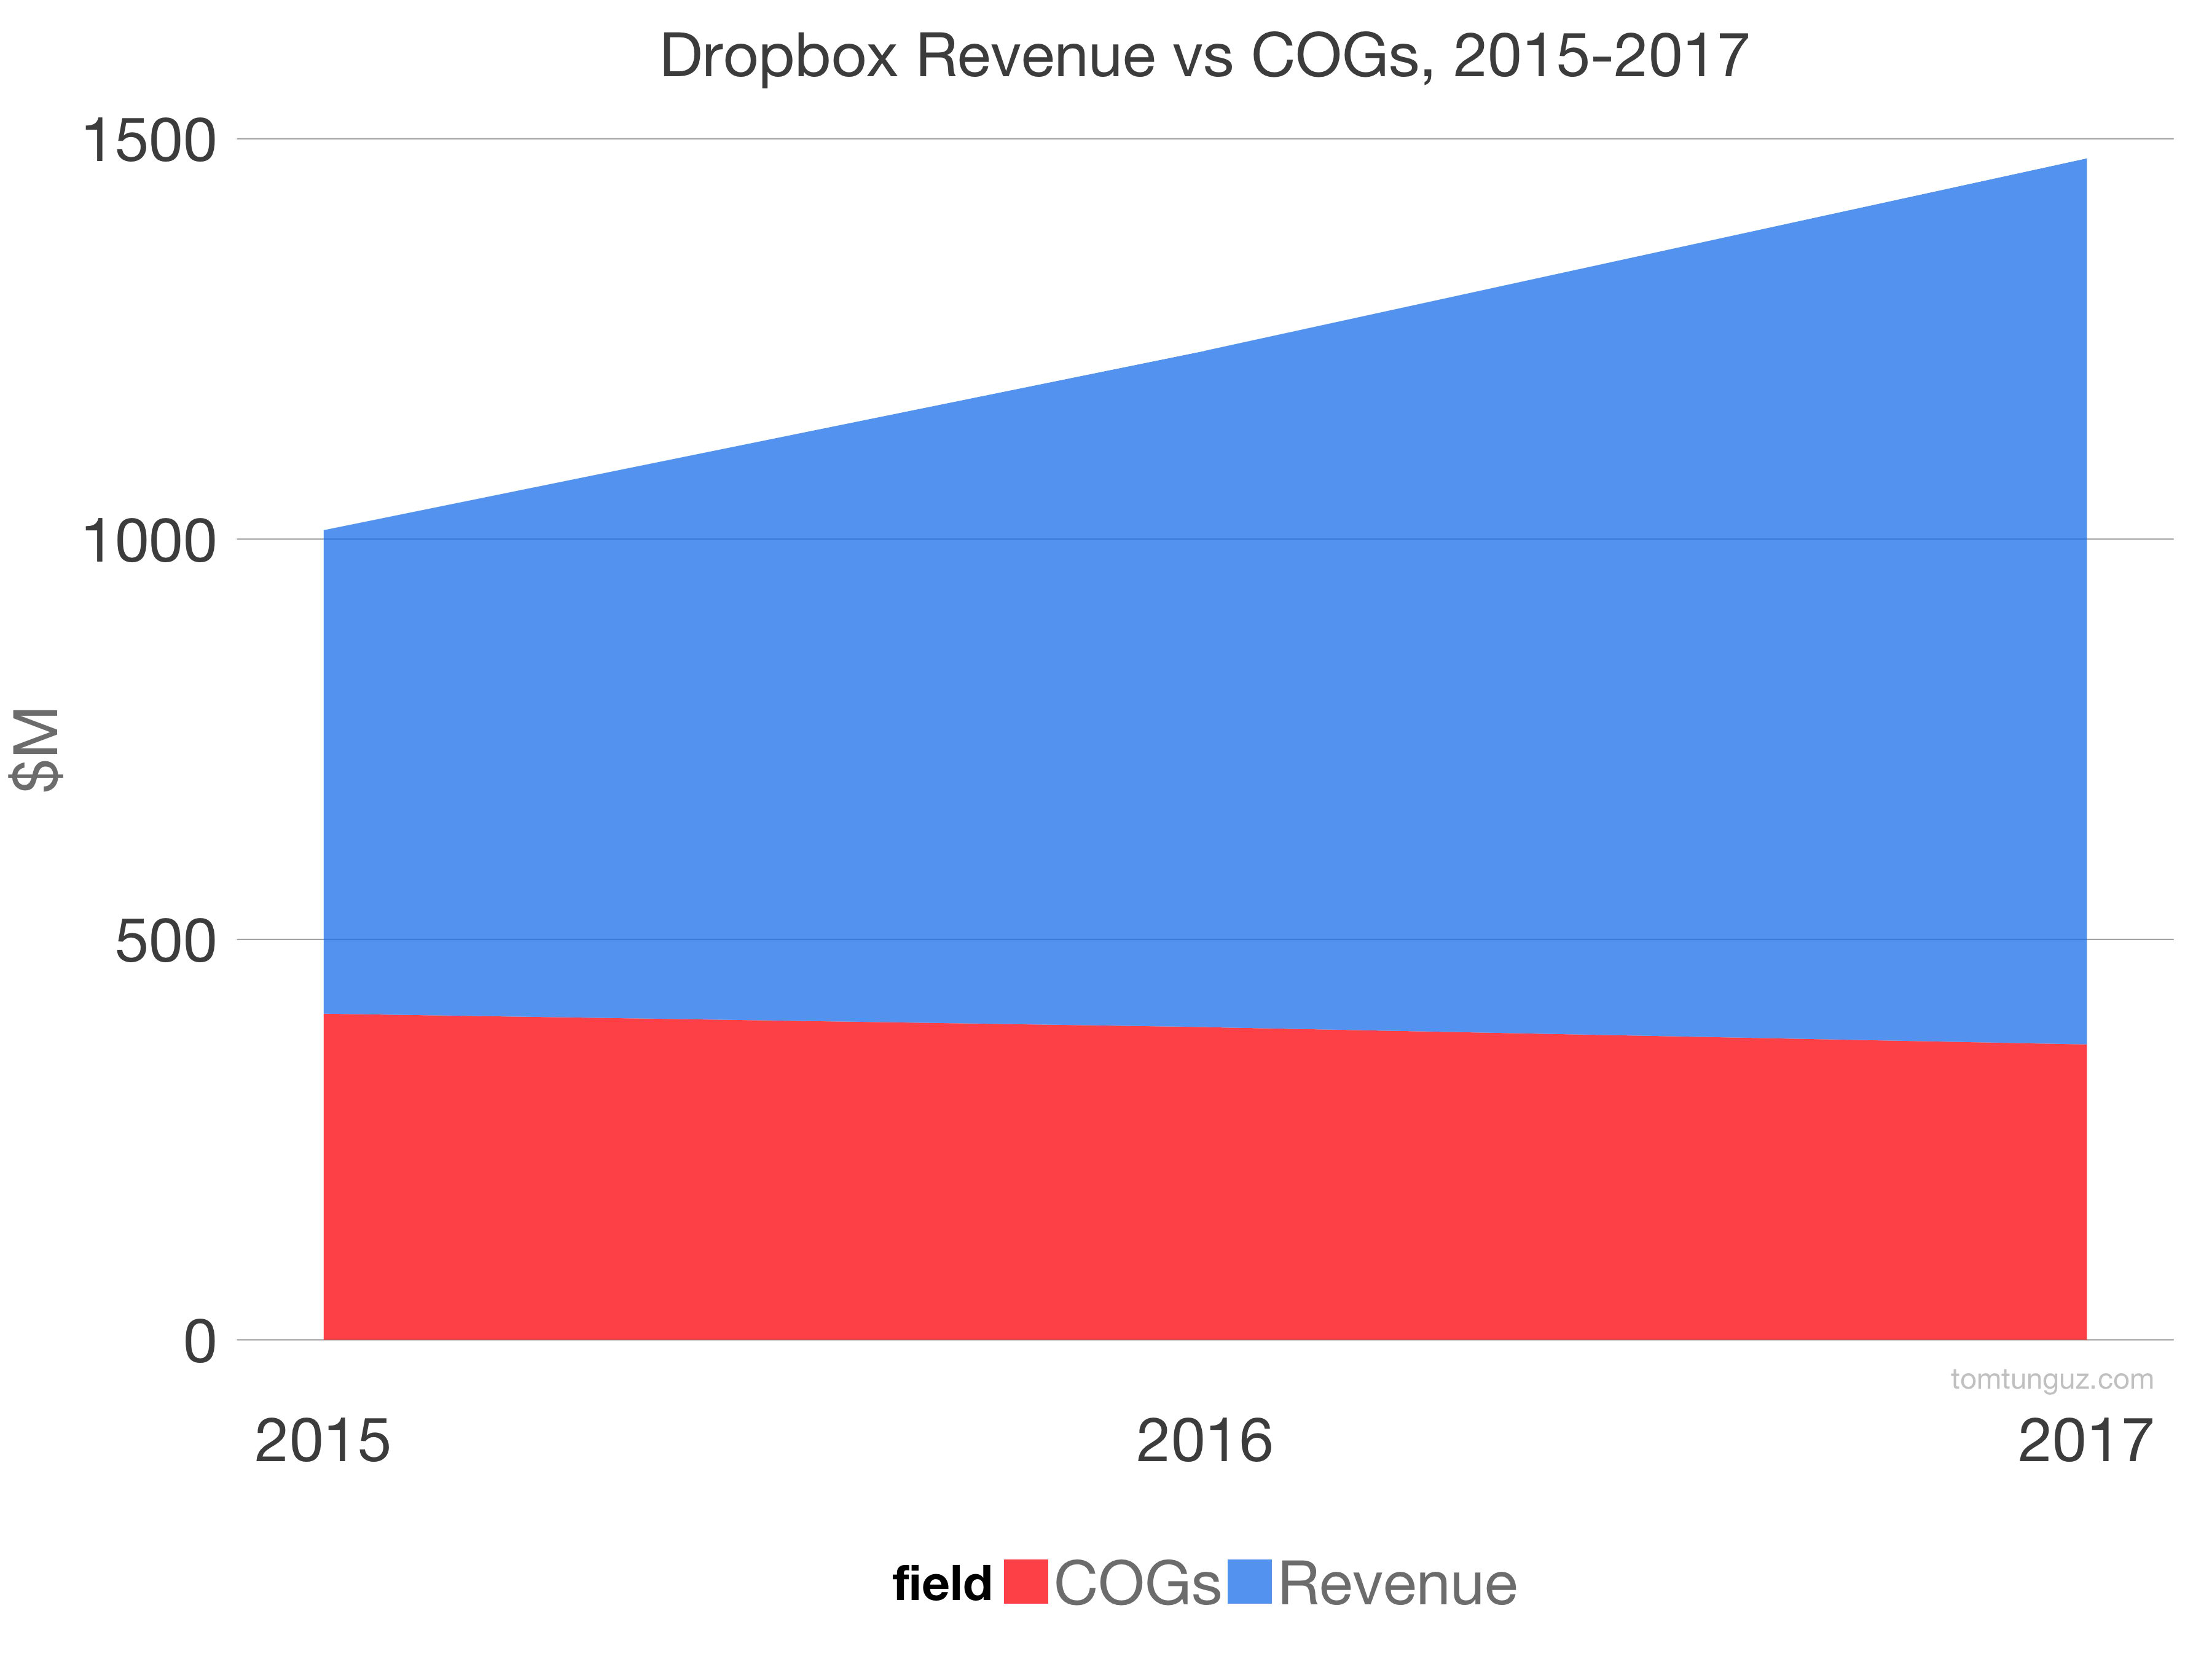
More impressive still: the company has managed to nearly double revenues while decreasing the amount they spent on COGs annually. COGs stands for cost of goods sold. Images of Dropbox, which stores billions of files, hard disks and storage are the principal component of COGs.
This decrease is driven by user policy changes that affect users who have been inactive for a year or more, and a shift to operating their own data centers instead of using cloud providers.
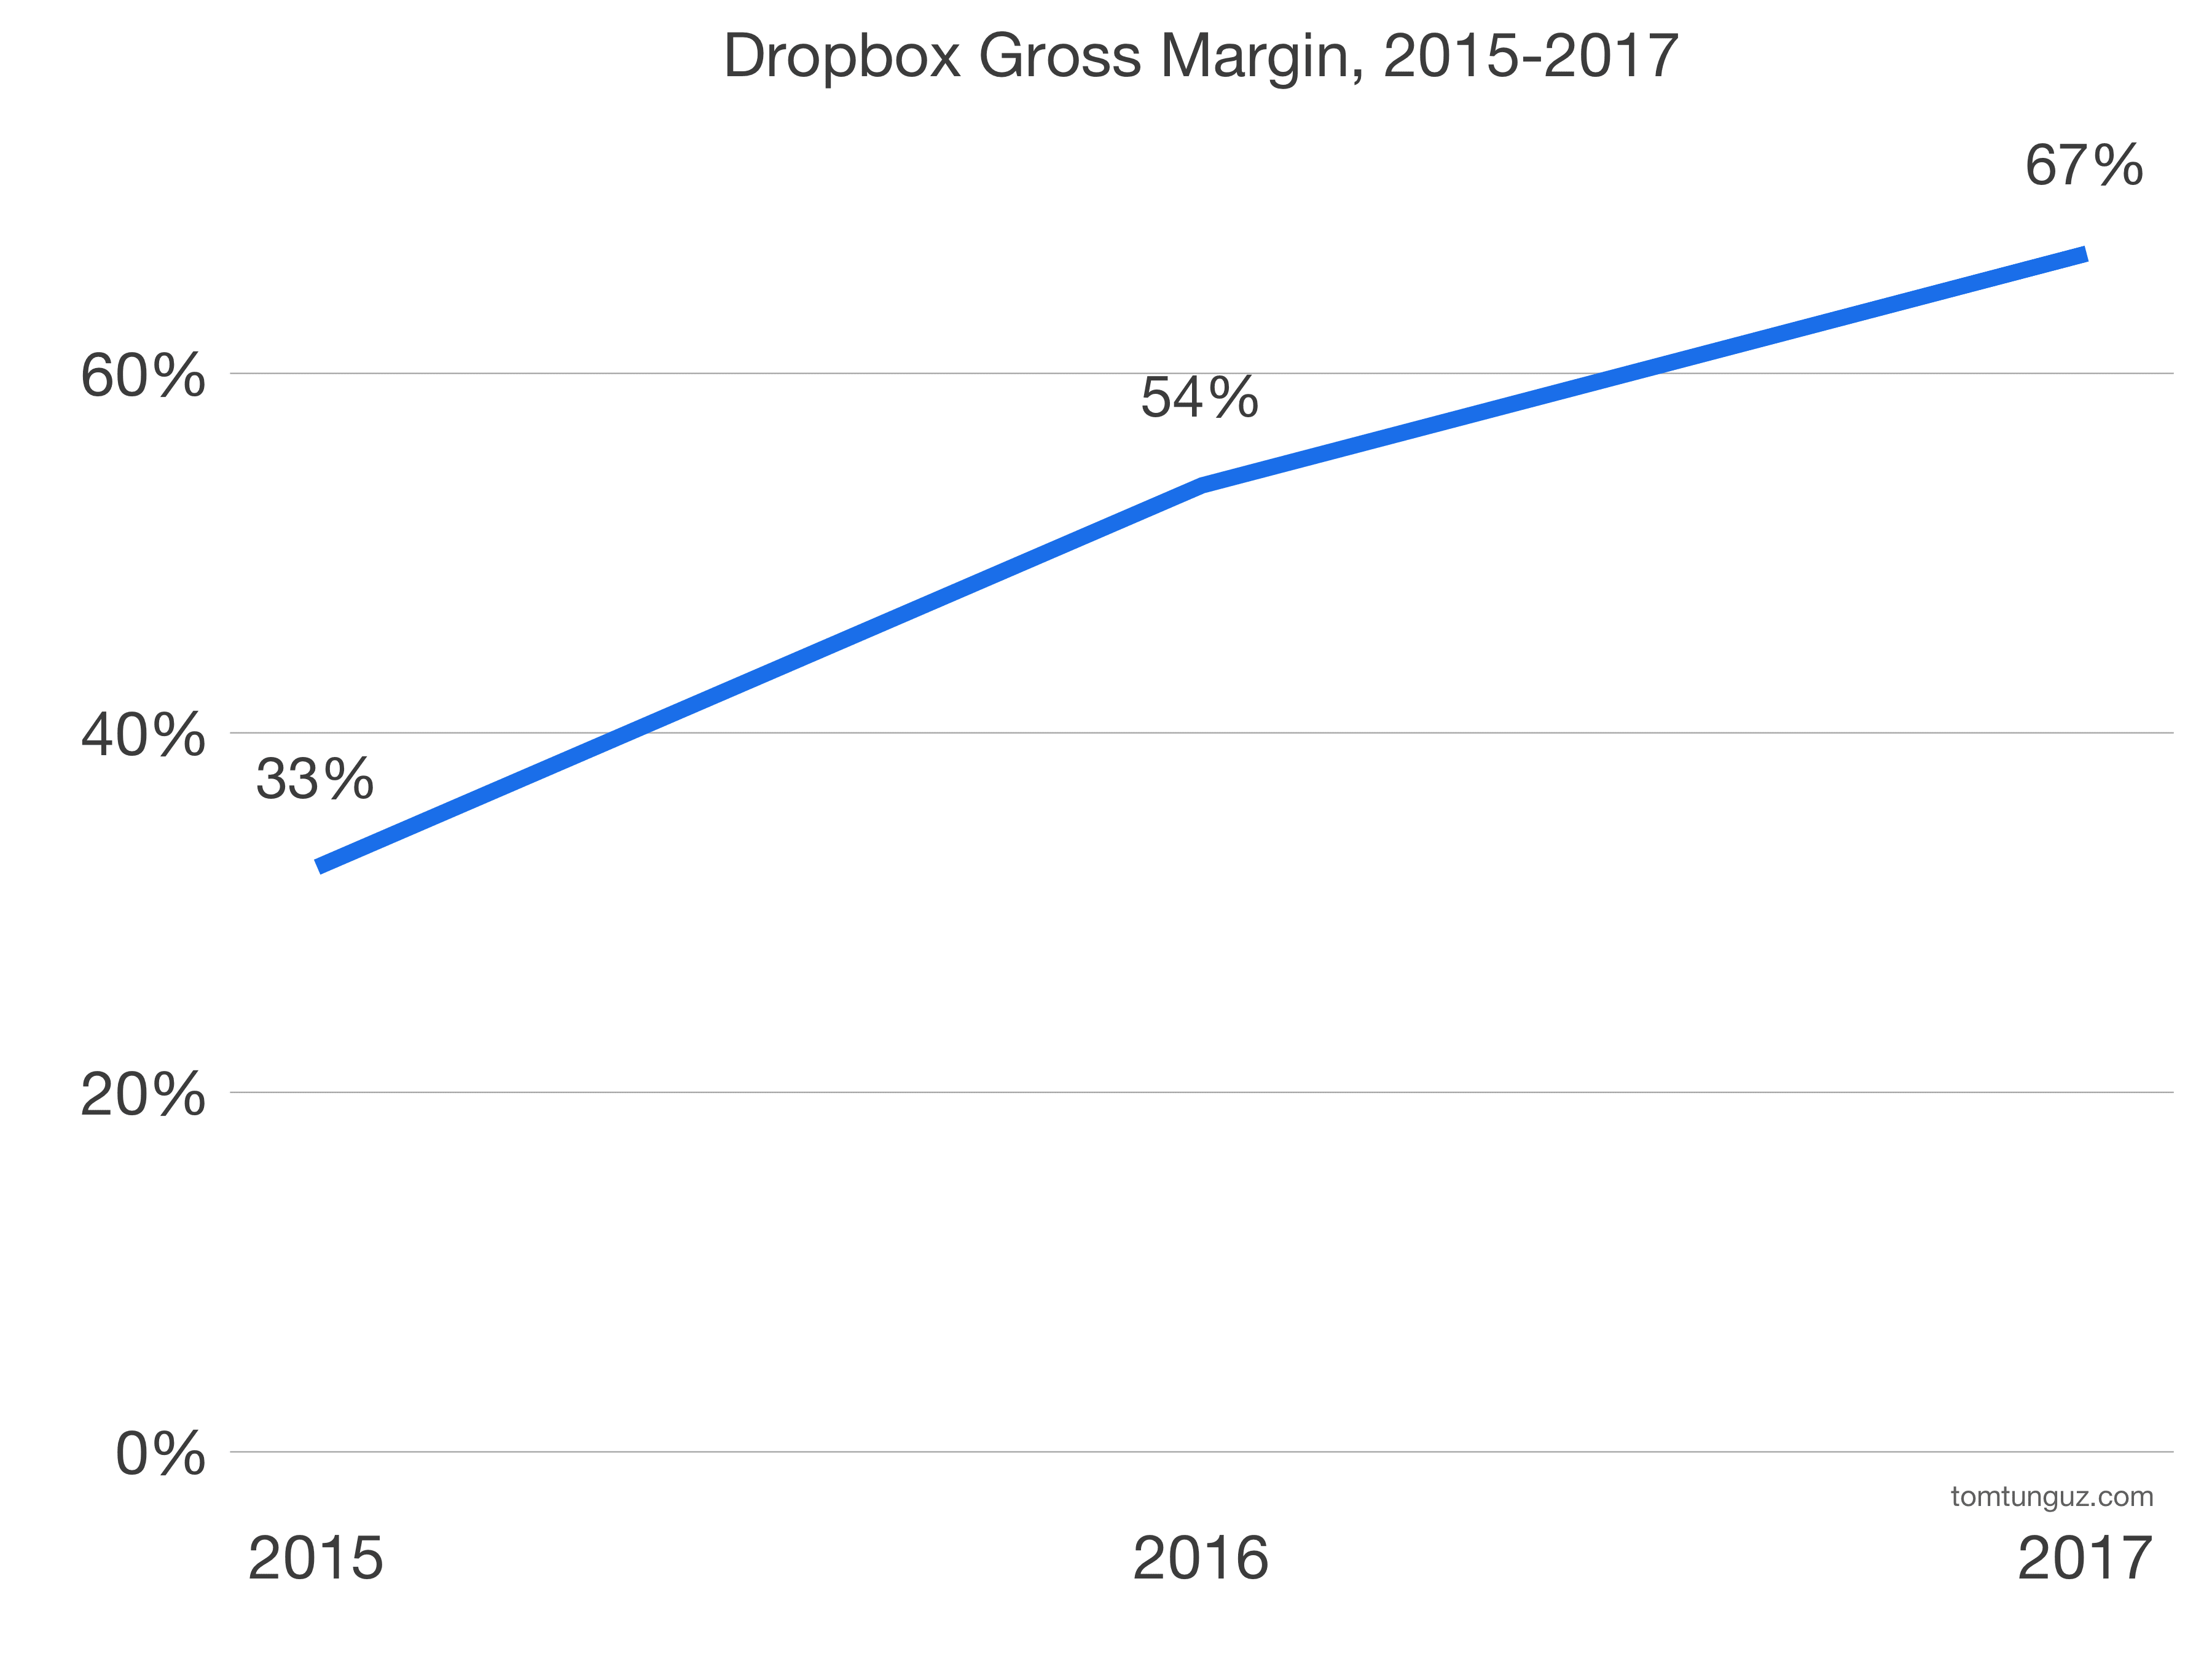
Gross margin has meaningfully improved over that time frame due to these efficiency gains. GM doubled over the same time frame, from 33% to 67%. Despite the enormous infrastructure overhead, Dropbox’s gross margin is rapidly approaching the public SaaS median of 71%.
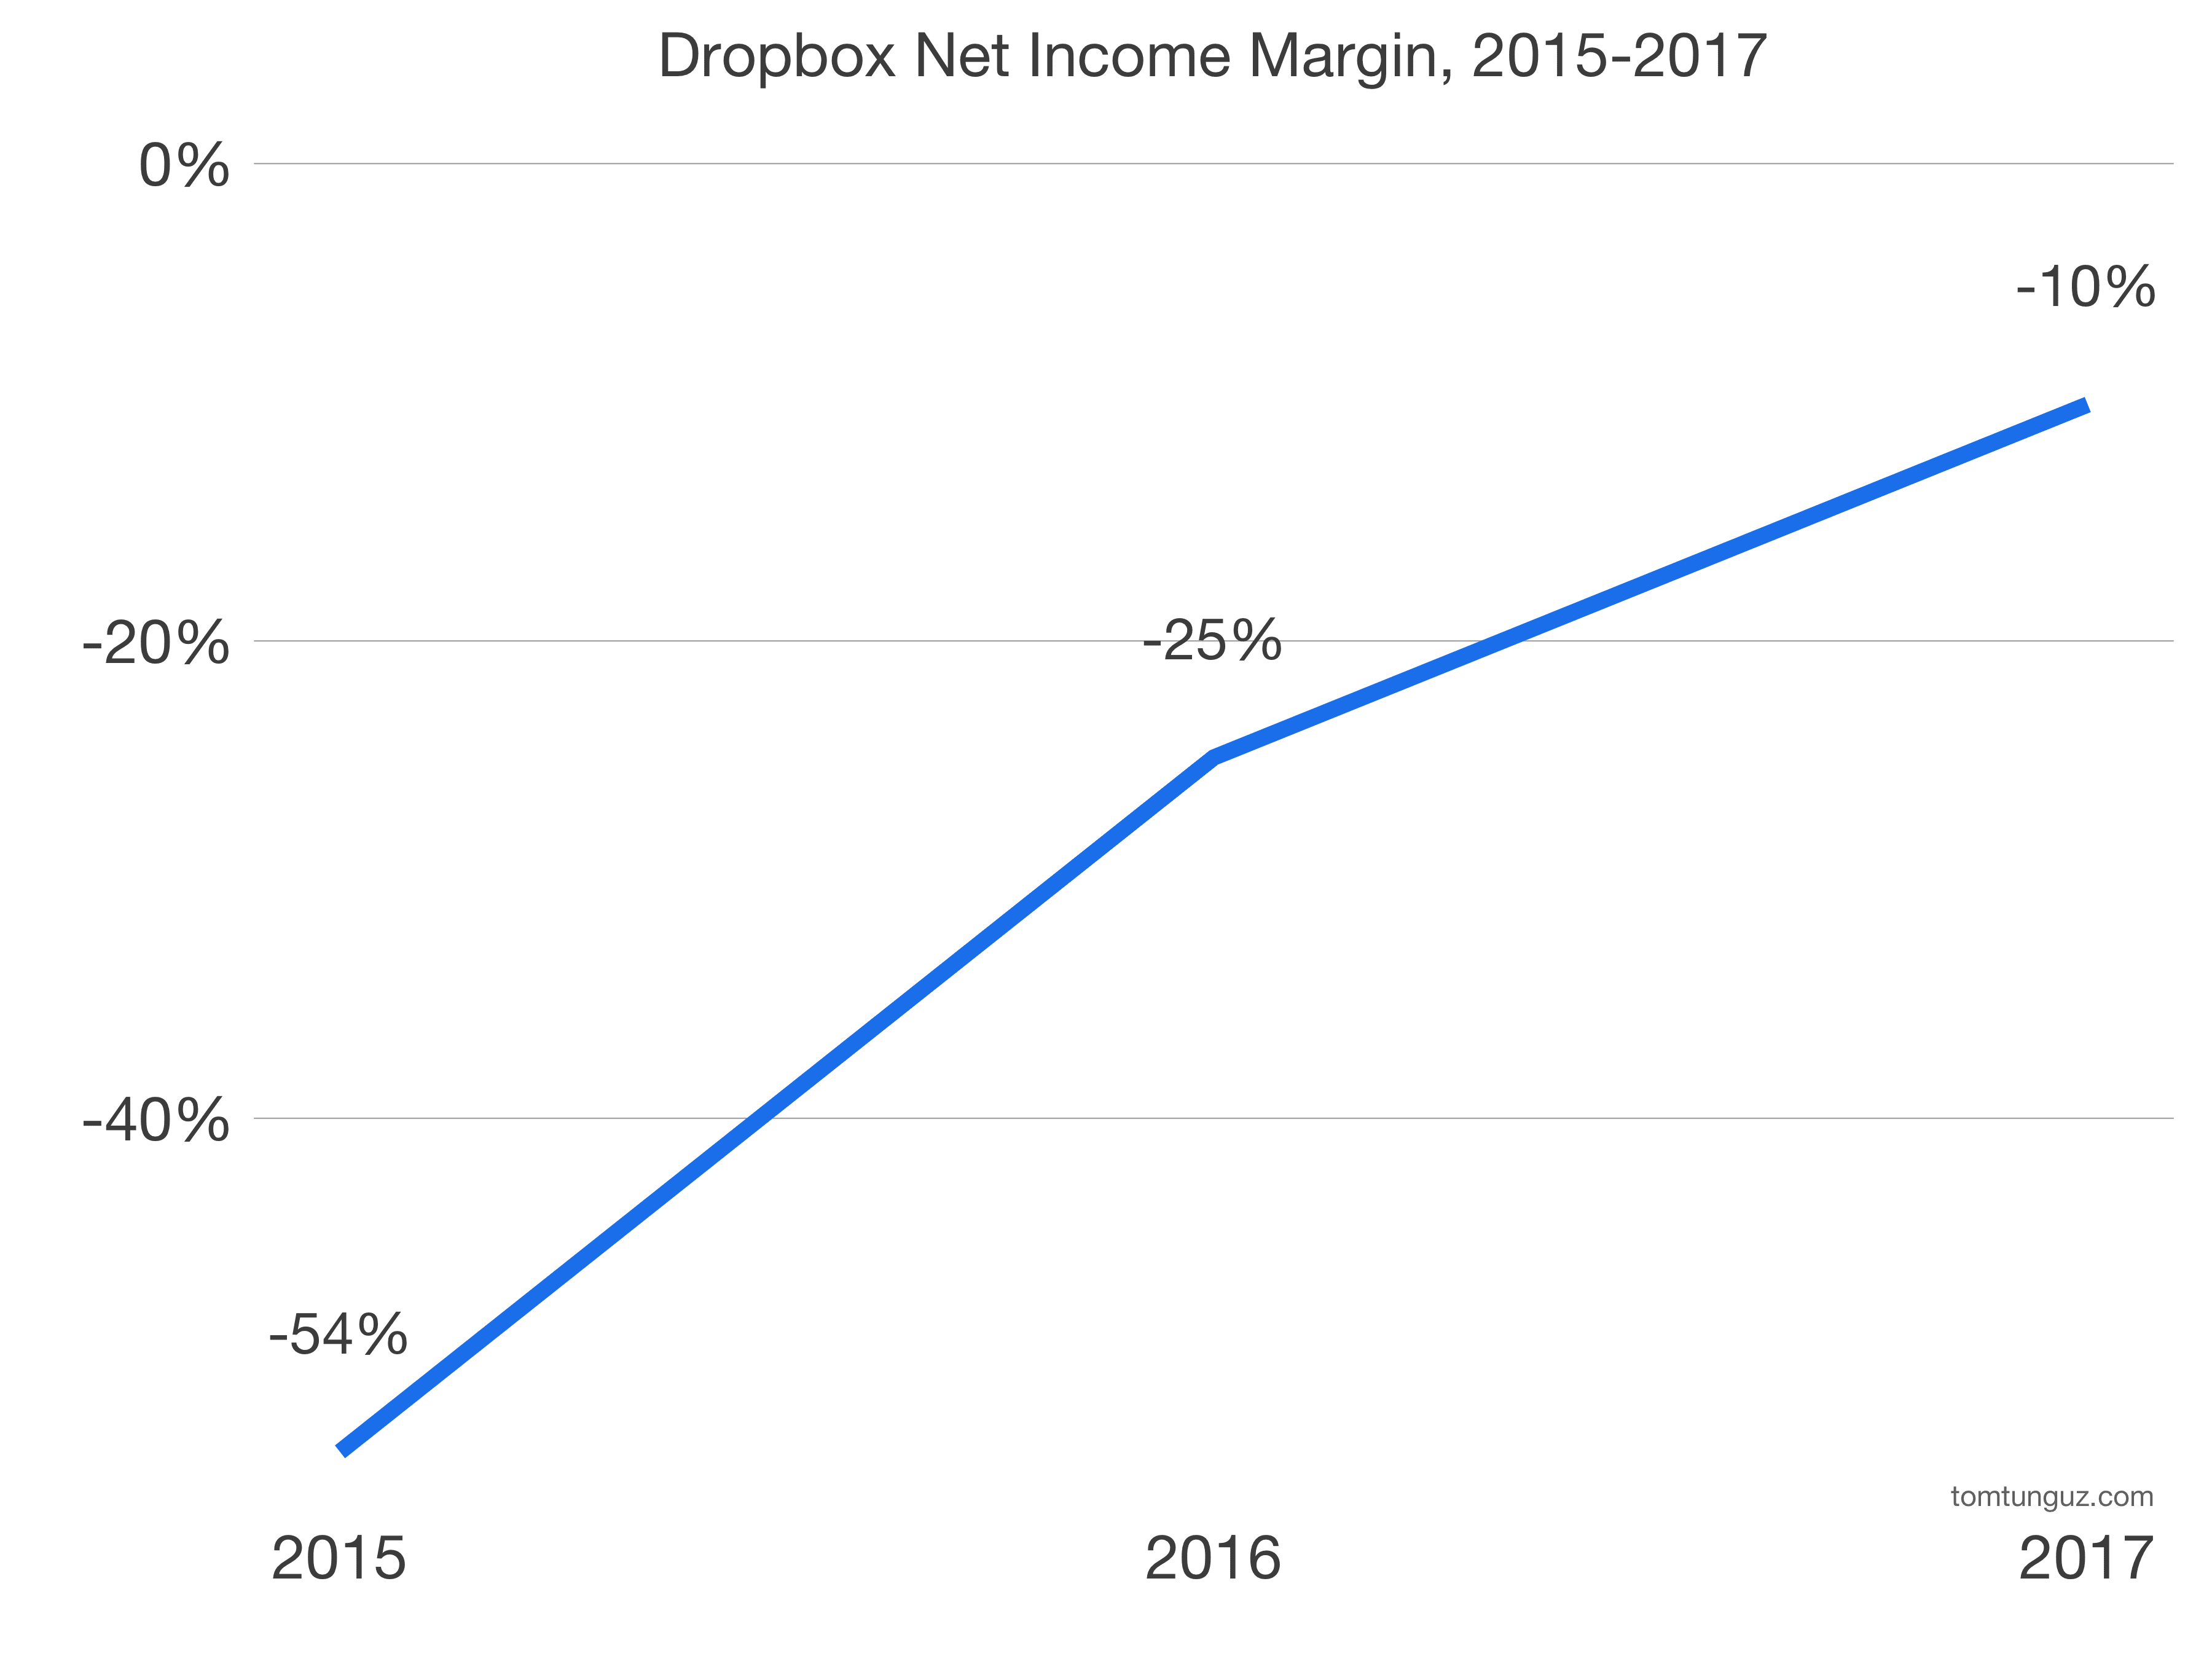
Net income margin has also approached public medians, now at -10%. Most SaaS companies operate their businesses in this range.
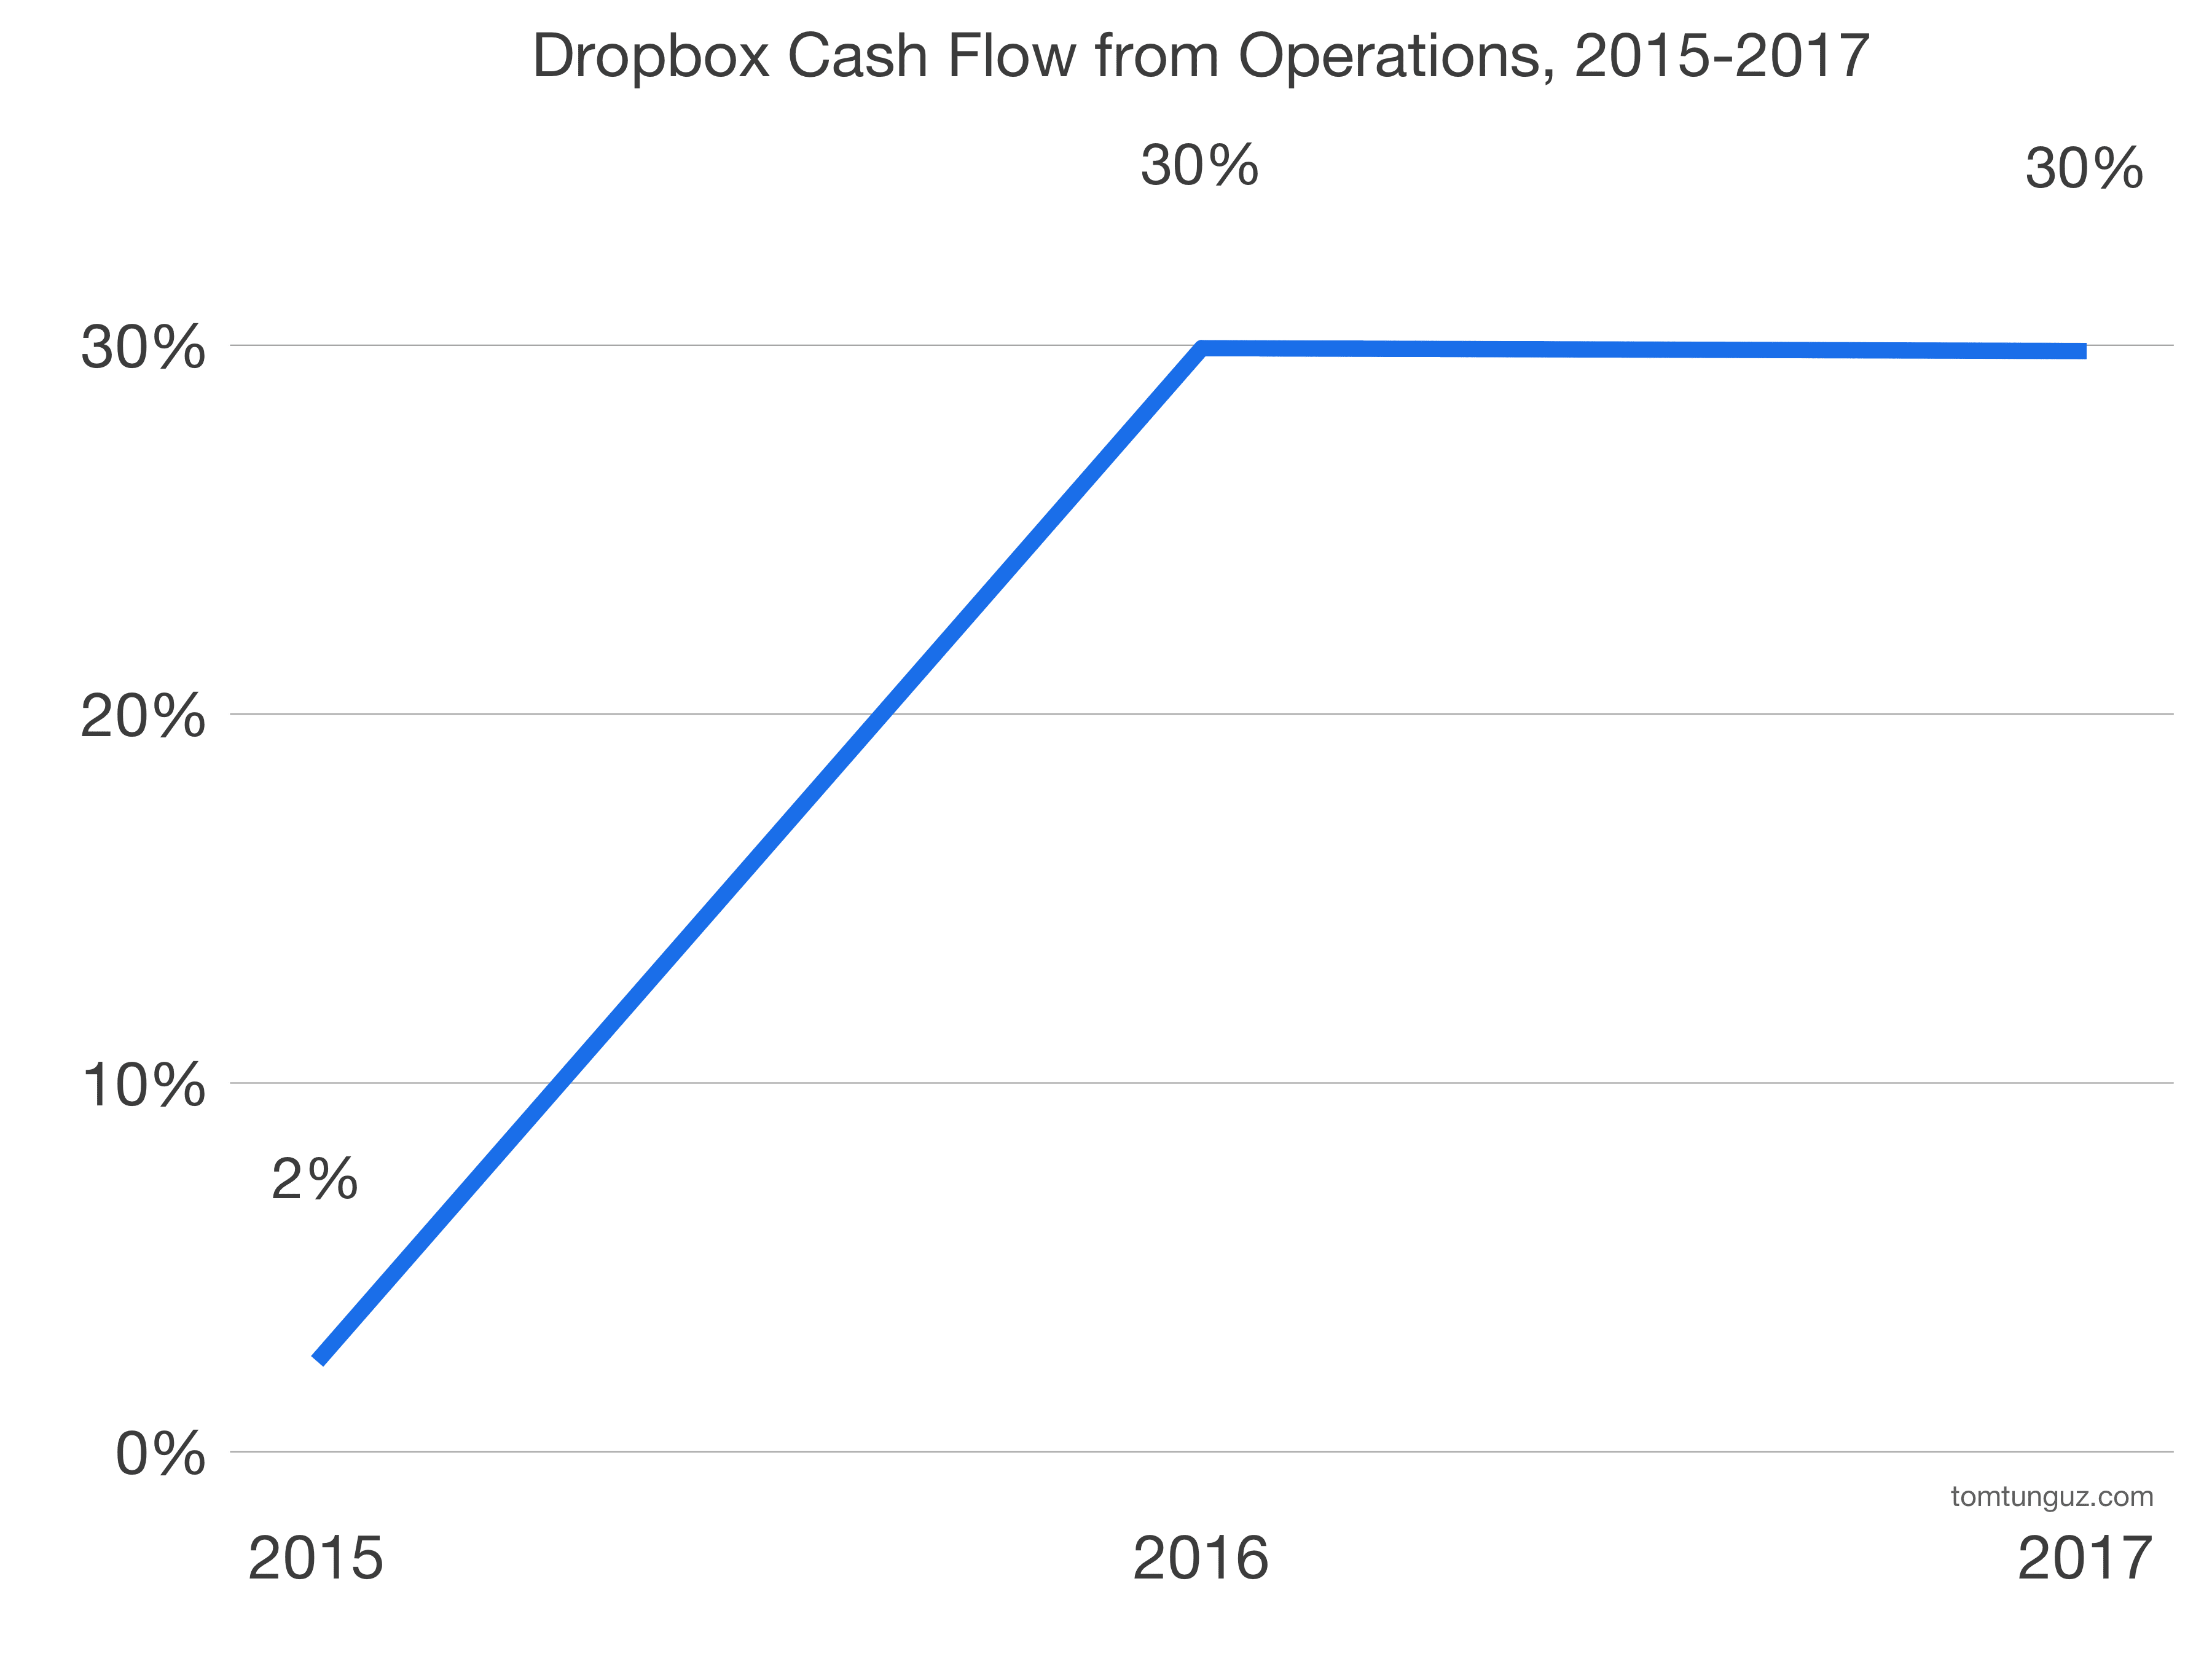
The benefits of freemium at scale appear in the free cash flow from operations metrics. In 2017, Dropbox generated more than $300M in free cash flow from ops, and for the past two years has sustained 30% cash flow from ops margins.
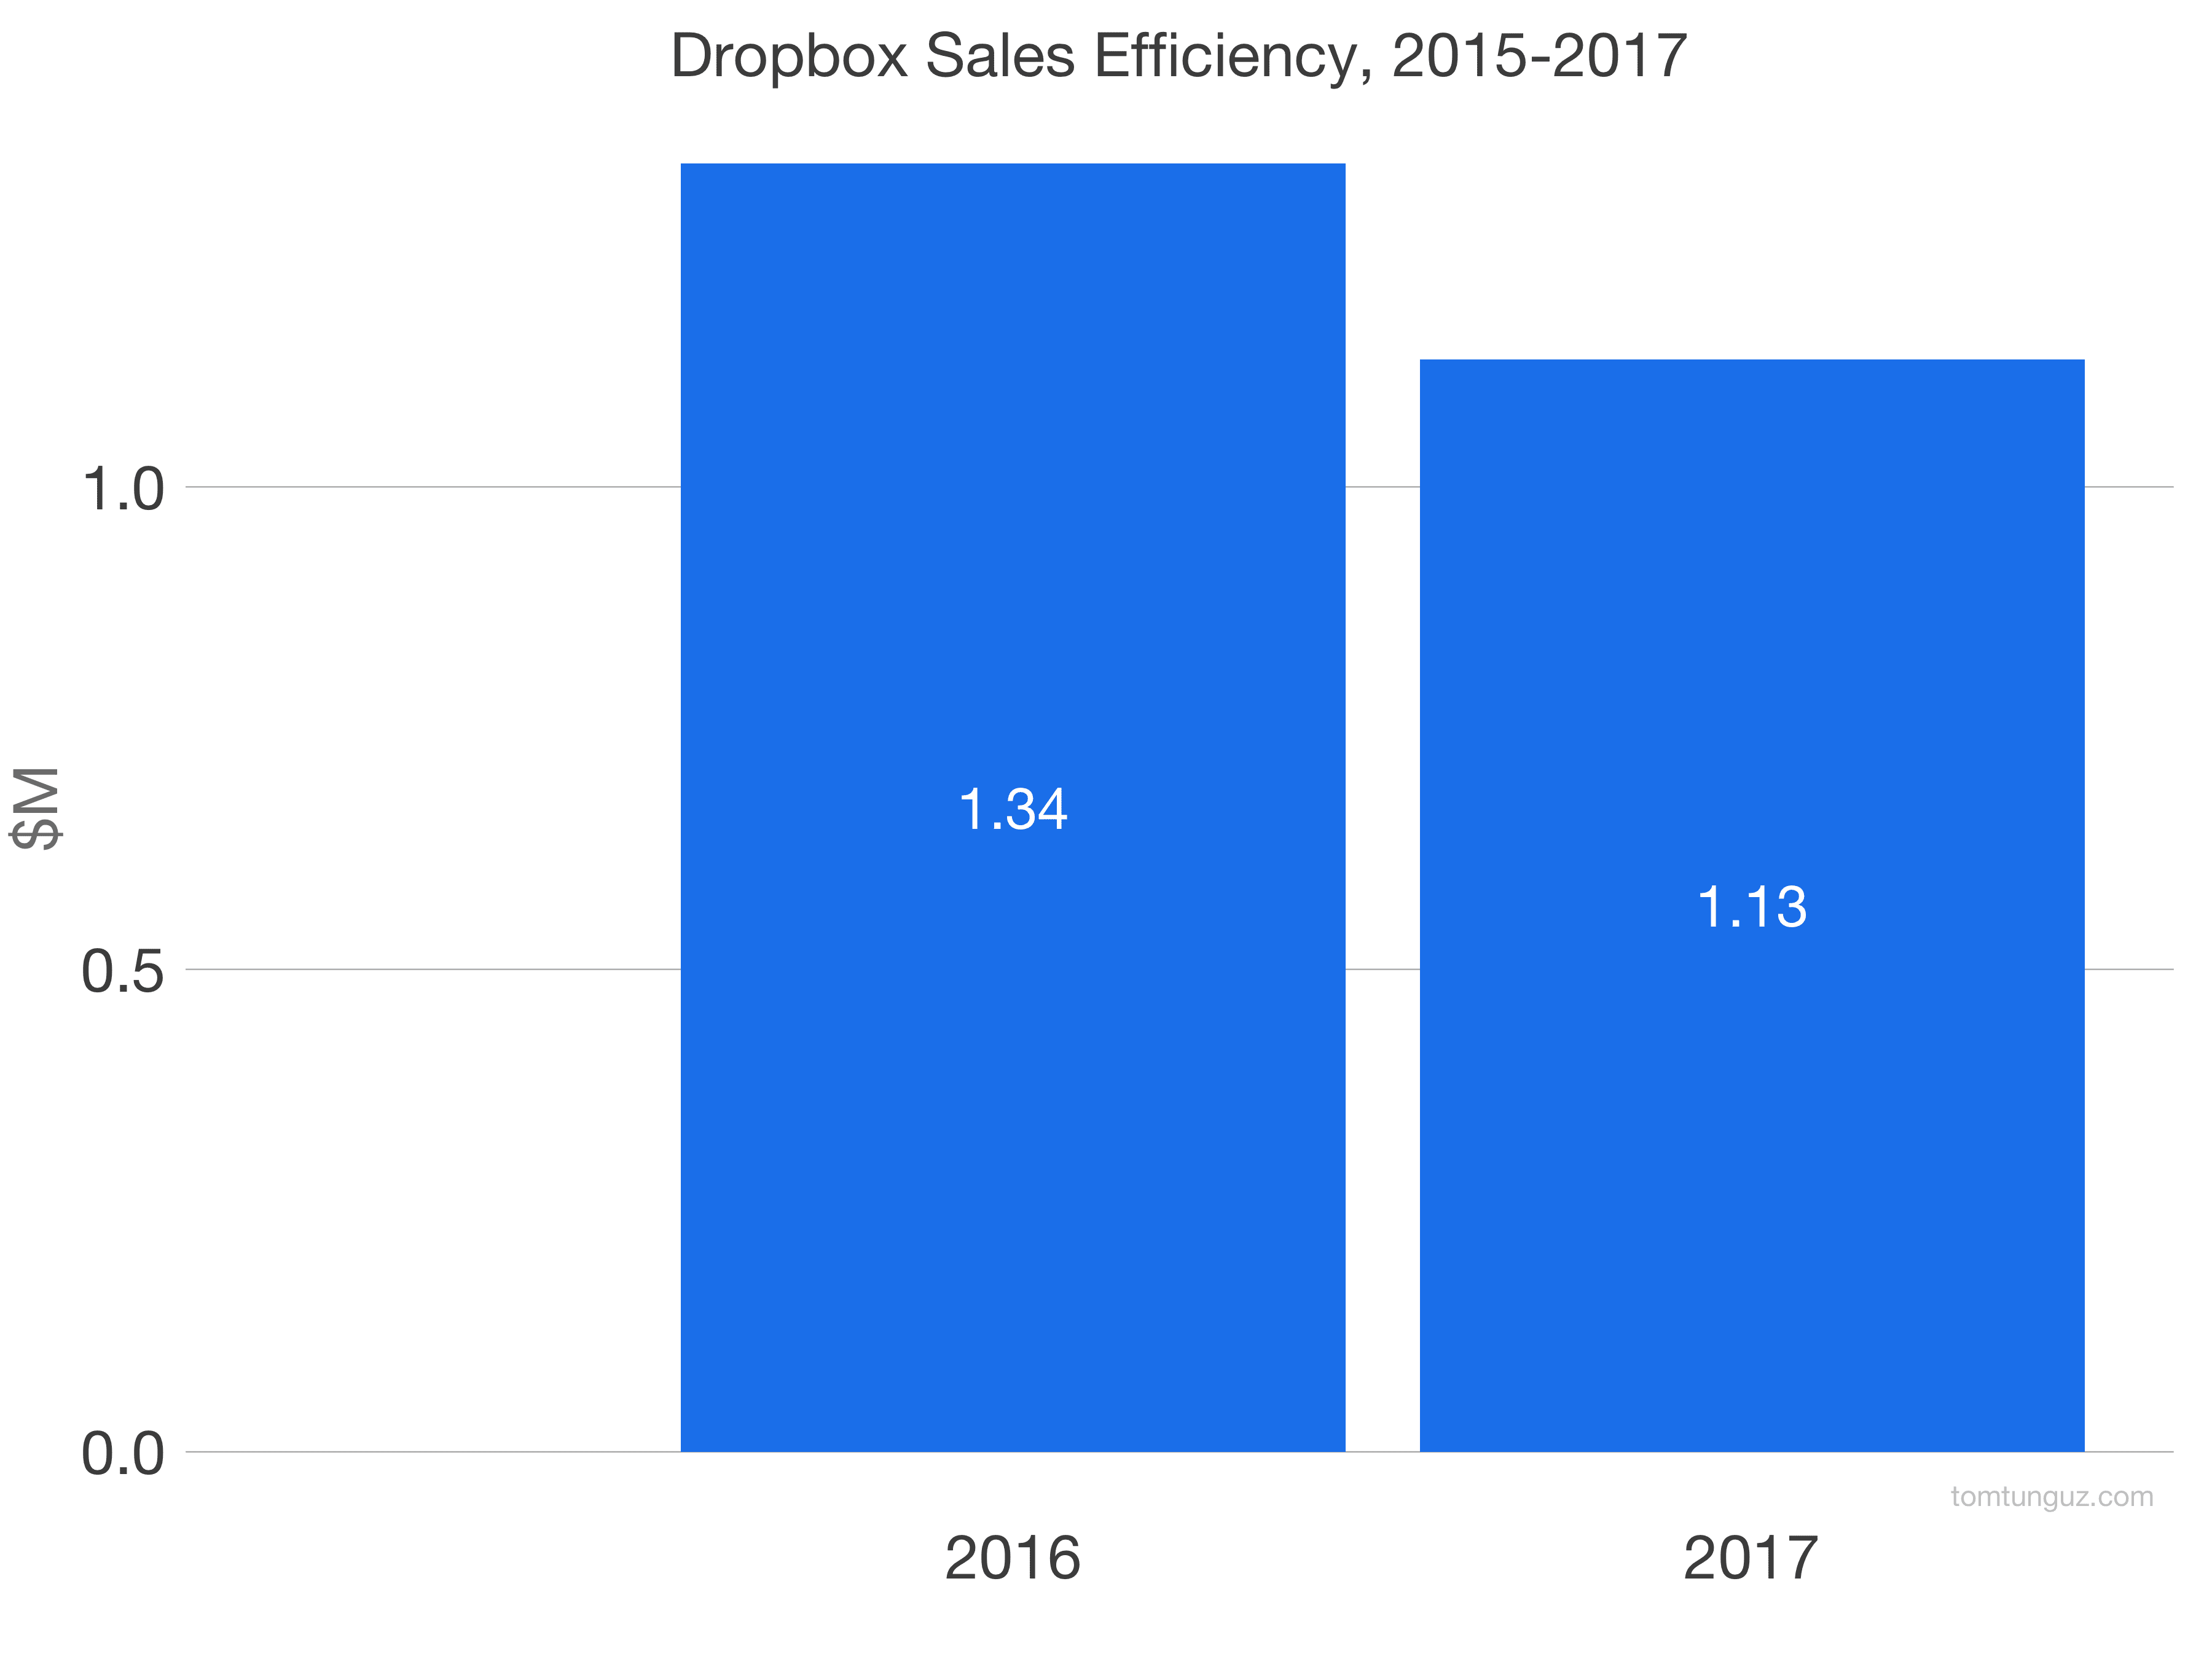
This cash flow results directly from the sales efficiency of the business. At an estimated sales efficiency of 1.1, Dropbox’s is among the highest of all publics among others stars like Shopify. Unlike other SaaS companies, Dropbox spends more of its revenue on engineering than sales and marketing. Typically, businesses spend twice as much on S&M.
| Field | Box | Dropbox |
|---|---|---|
| Revenue | 399 | 1,107 |
| Revenue Growth | 32% | 31% |
| Gross Margin | 72% | 67% |
| Net Income Margin | -38.1 | -0.1 |
| Free Cash from Ops, $M | -1 | 330 |
| Free Cash from Ops Margin | 0% | 30% |
| Est Sales Efficiency | 0.4 | 1.1 |
| MC/2017 Rev Multiple | 7.97 | 7.97 |
| Market Cap | 3,175 | 8,816 |
The comparison to Box, a competitor from the earliest days in YCombinator, is inevitable. The table summarizes some key metrics.
Dropbox generates more than twice as much revenue, but grows at the same rate. The businesses have roughly comparable gross margins. But Dropbox’s net income and free cash flow from operations margins are substantially higher, because of the self-serve customer acquisition dynamics. Dropbox generates about 2x more in gross profit per dollar in sales and marketing spend than Box.
Assuming the market values Dropbox similarly to Box, the implied market cap for Dropbox is roughly $9B. However, Dropbox should benefit from a better multiple given its cash and sales efficiency. Dropbox is an impressively efficient business that epitomizes the strategic advantages of the freemium go-to-market strategy.
Disclosure: I work for Redpoint Ventures which holds shares of Dropbox.