Last week, Elastic filed their S-1 to go public. Elastic is a Dutch company founded in 2012. Just five years later, the company generated $159.9M in revenue. Elastic commercializes open source software called the Elastic Stack, a set of different products that enable users to search and store data in many different sources and formats. This software is used for application search, website search, enterprise search, application performance monitoring, and analytics for business and security data.
To put this company’s exceptional success in context, I plotted their metrics alongside Mulesoft, another enormously successful open source company that Salesforce acquired for $6.5B. In the charts that follow, I have plotted Elastic’s metrics the two years before their IPO, marked as -2 and -1. I have plotted Mulesoft’s metrics from 2015 and 2016, which was -3 and -2 years before IPO, but the companies were at similar scales.
There are many important difference between these two companies. The most salient: the average customer value. Mulesoft pursues much larger contracts. At IPO, a new customer generated $143,000 in revenue. Elastic, on the other hand, focuses more on the midmarket. Their ACV is $32k. this implies different go to market motions, different fractions of revenue generated from on premises versus hosted deployments, and likely different composition of their sales teams. Now, onto the numbers:
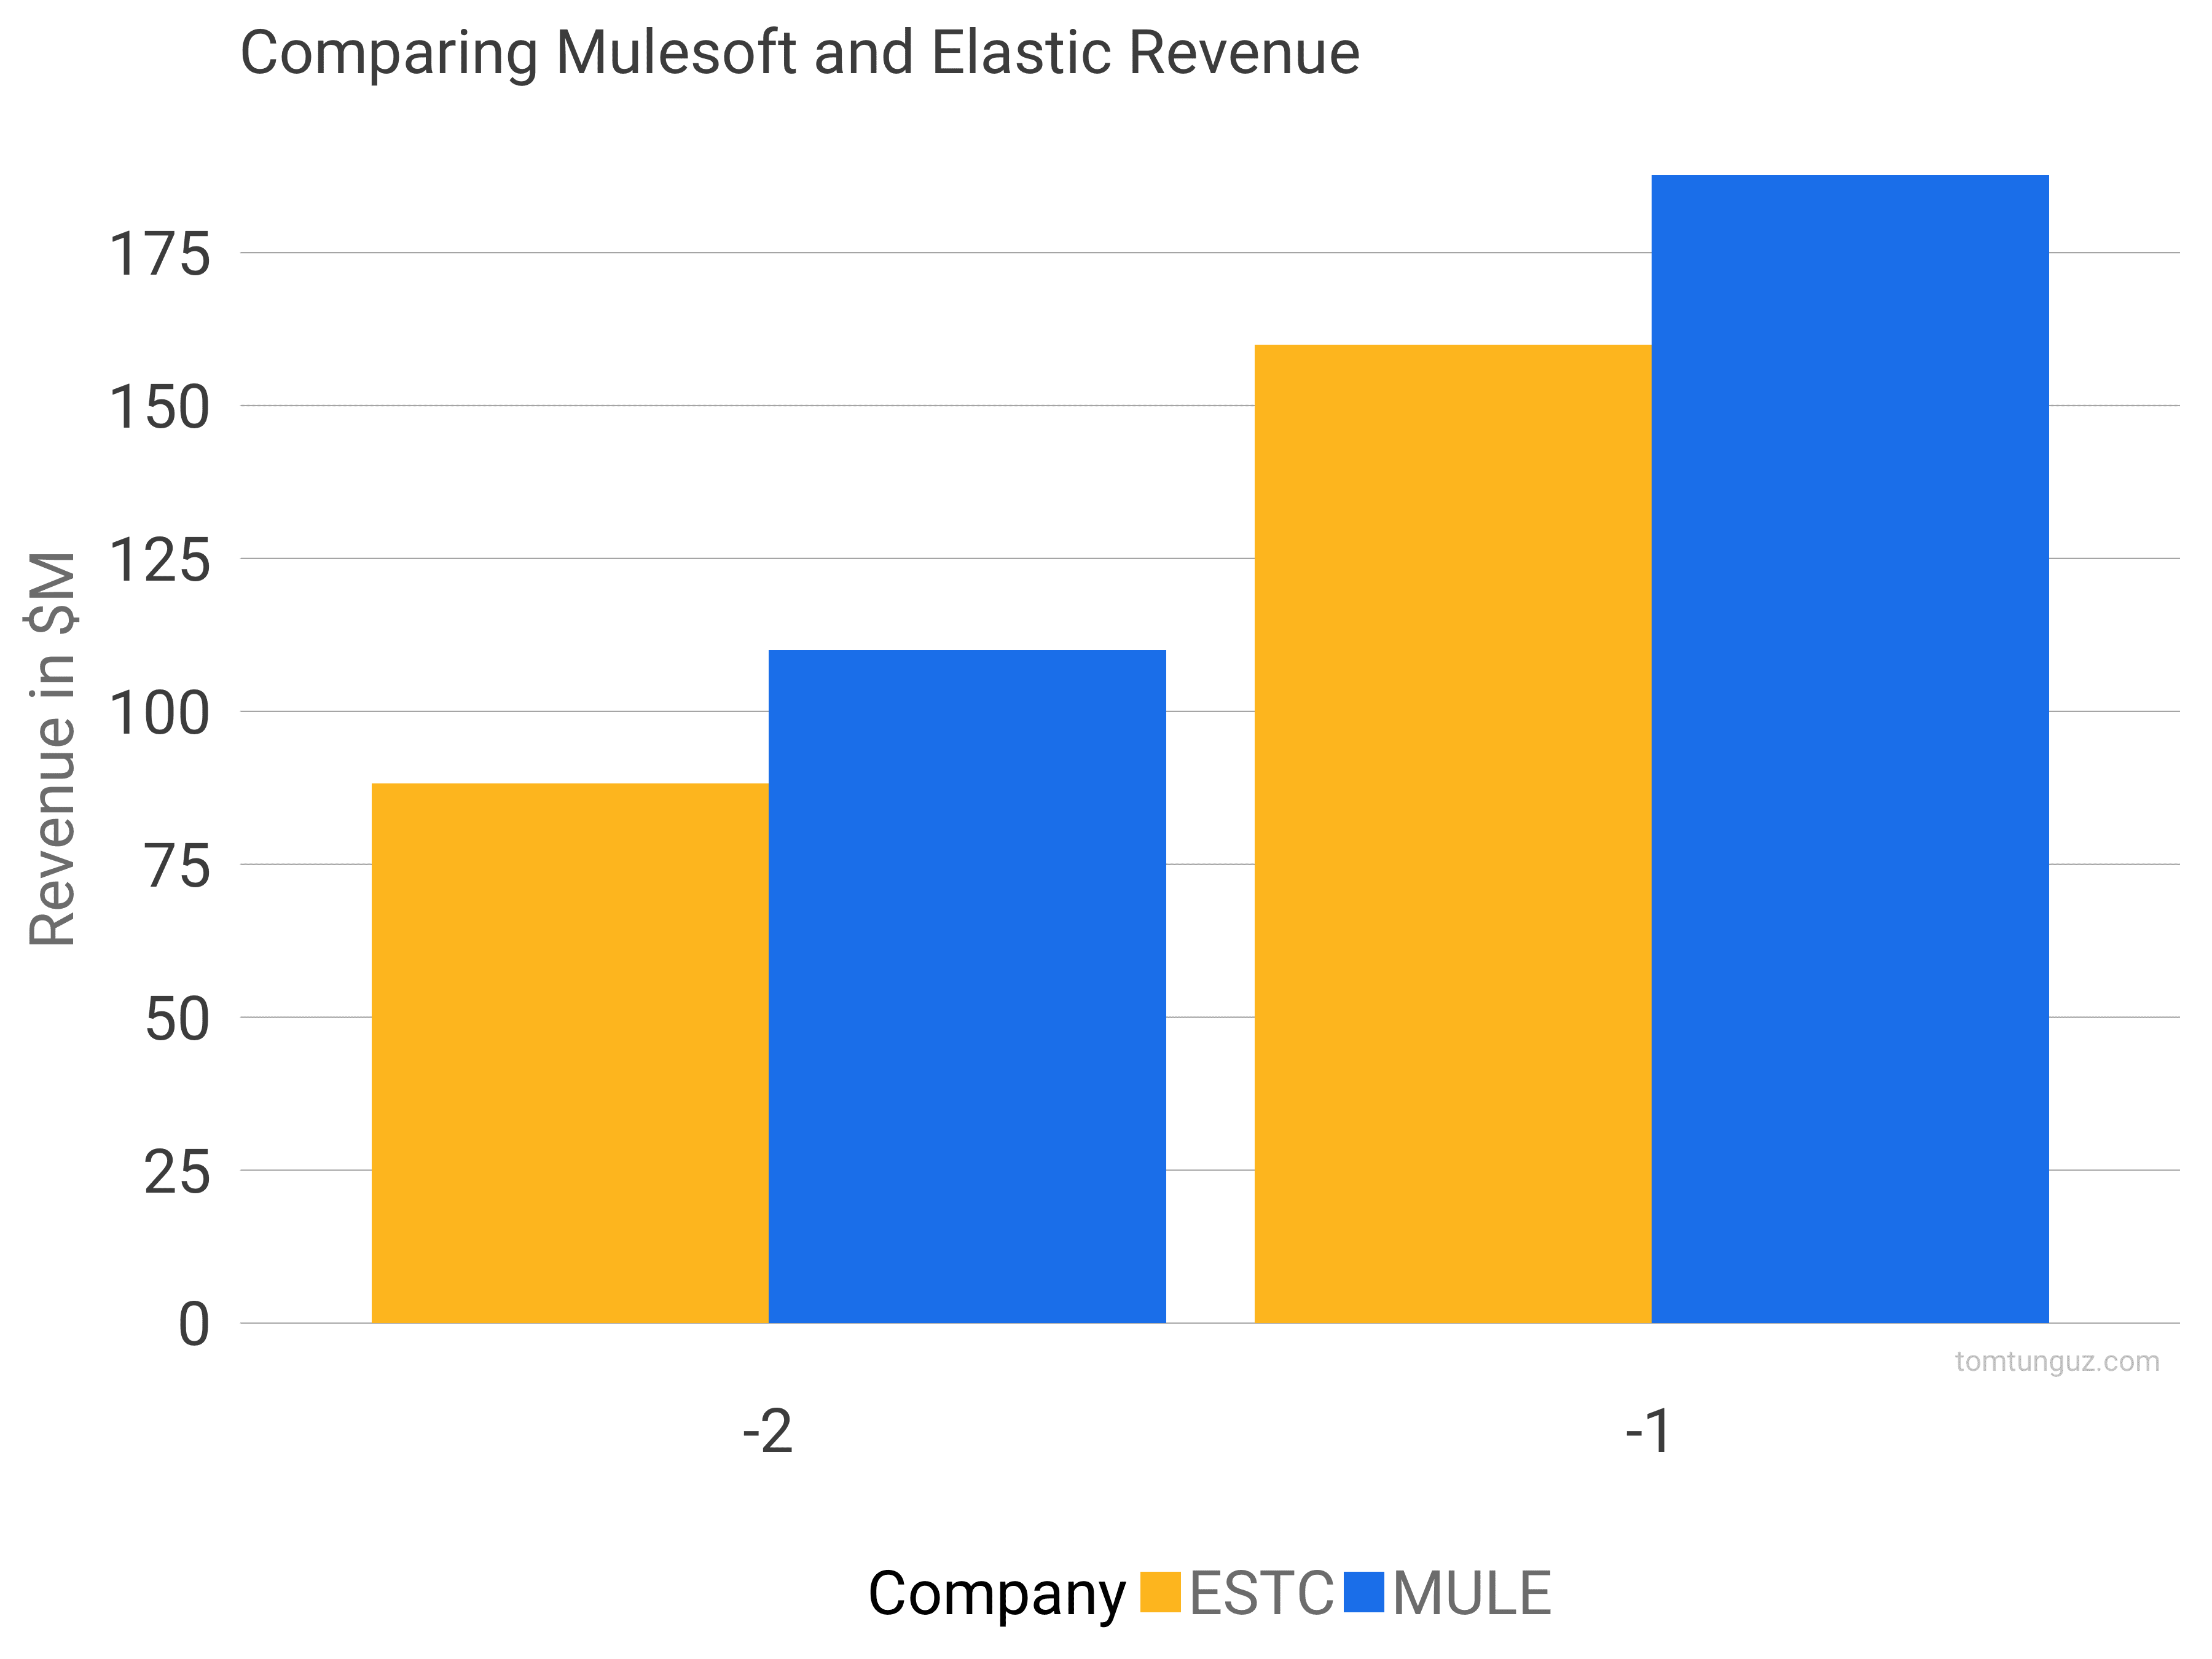
First, let’s examine revenue. Elastic grew from $88.2M to $159.9M, an 80% annual growth rate. Mulesoft grew from $110 million to $188 million, a 71% growth rate. To grow at these rates and at this scale is exceptional.
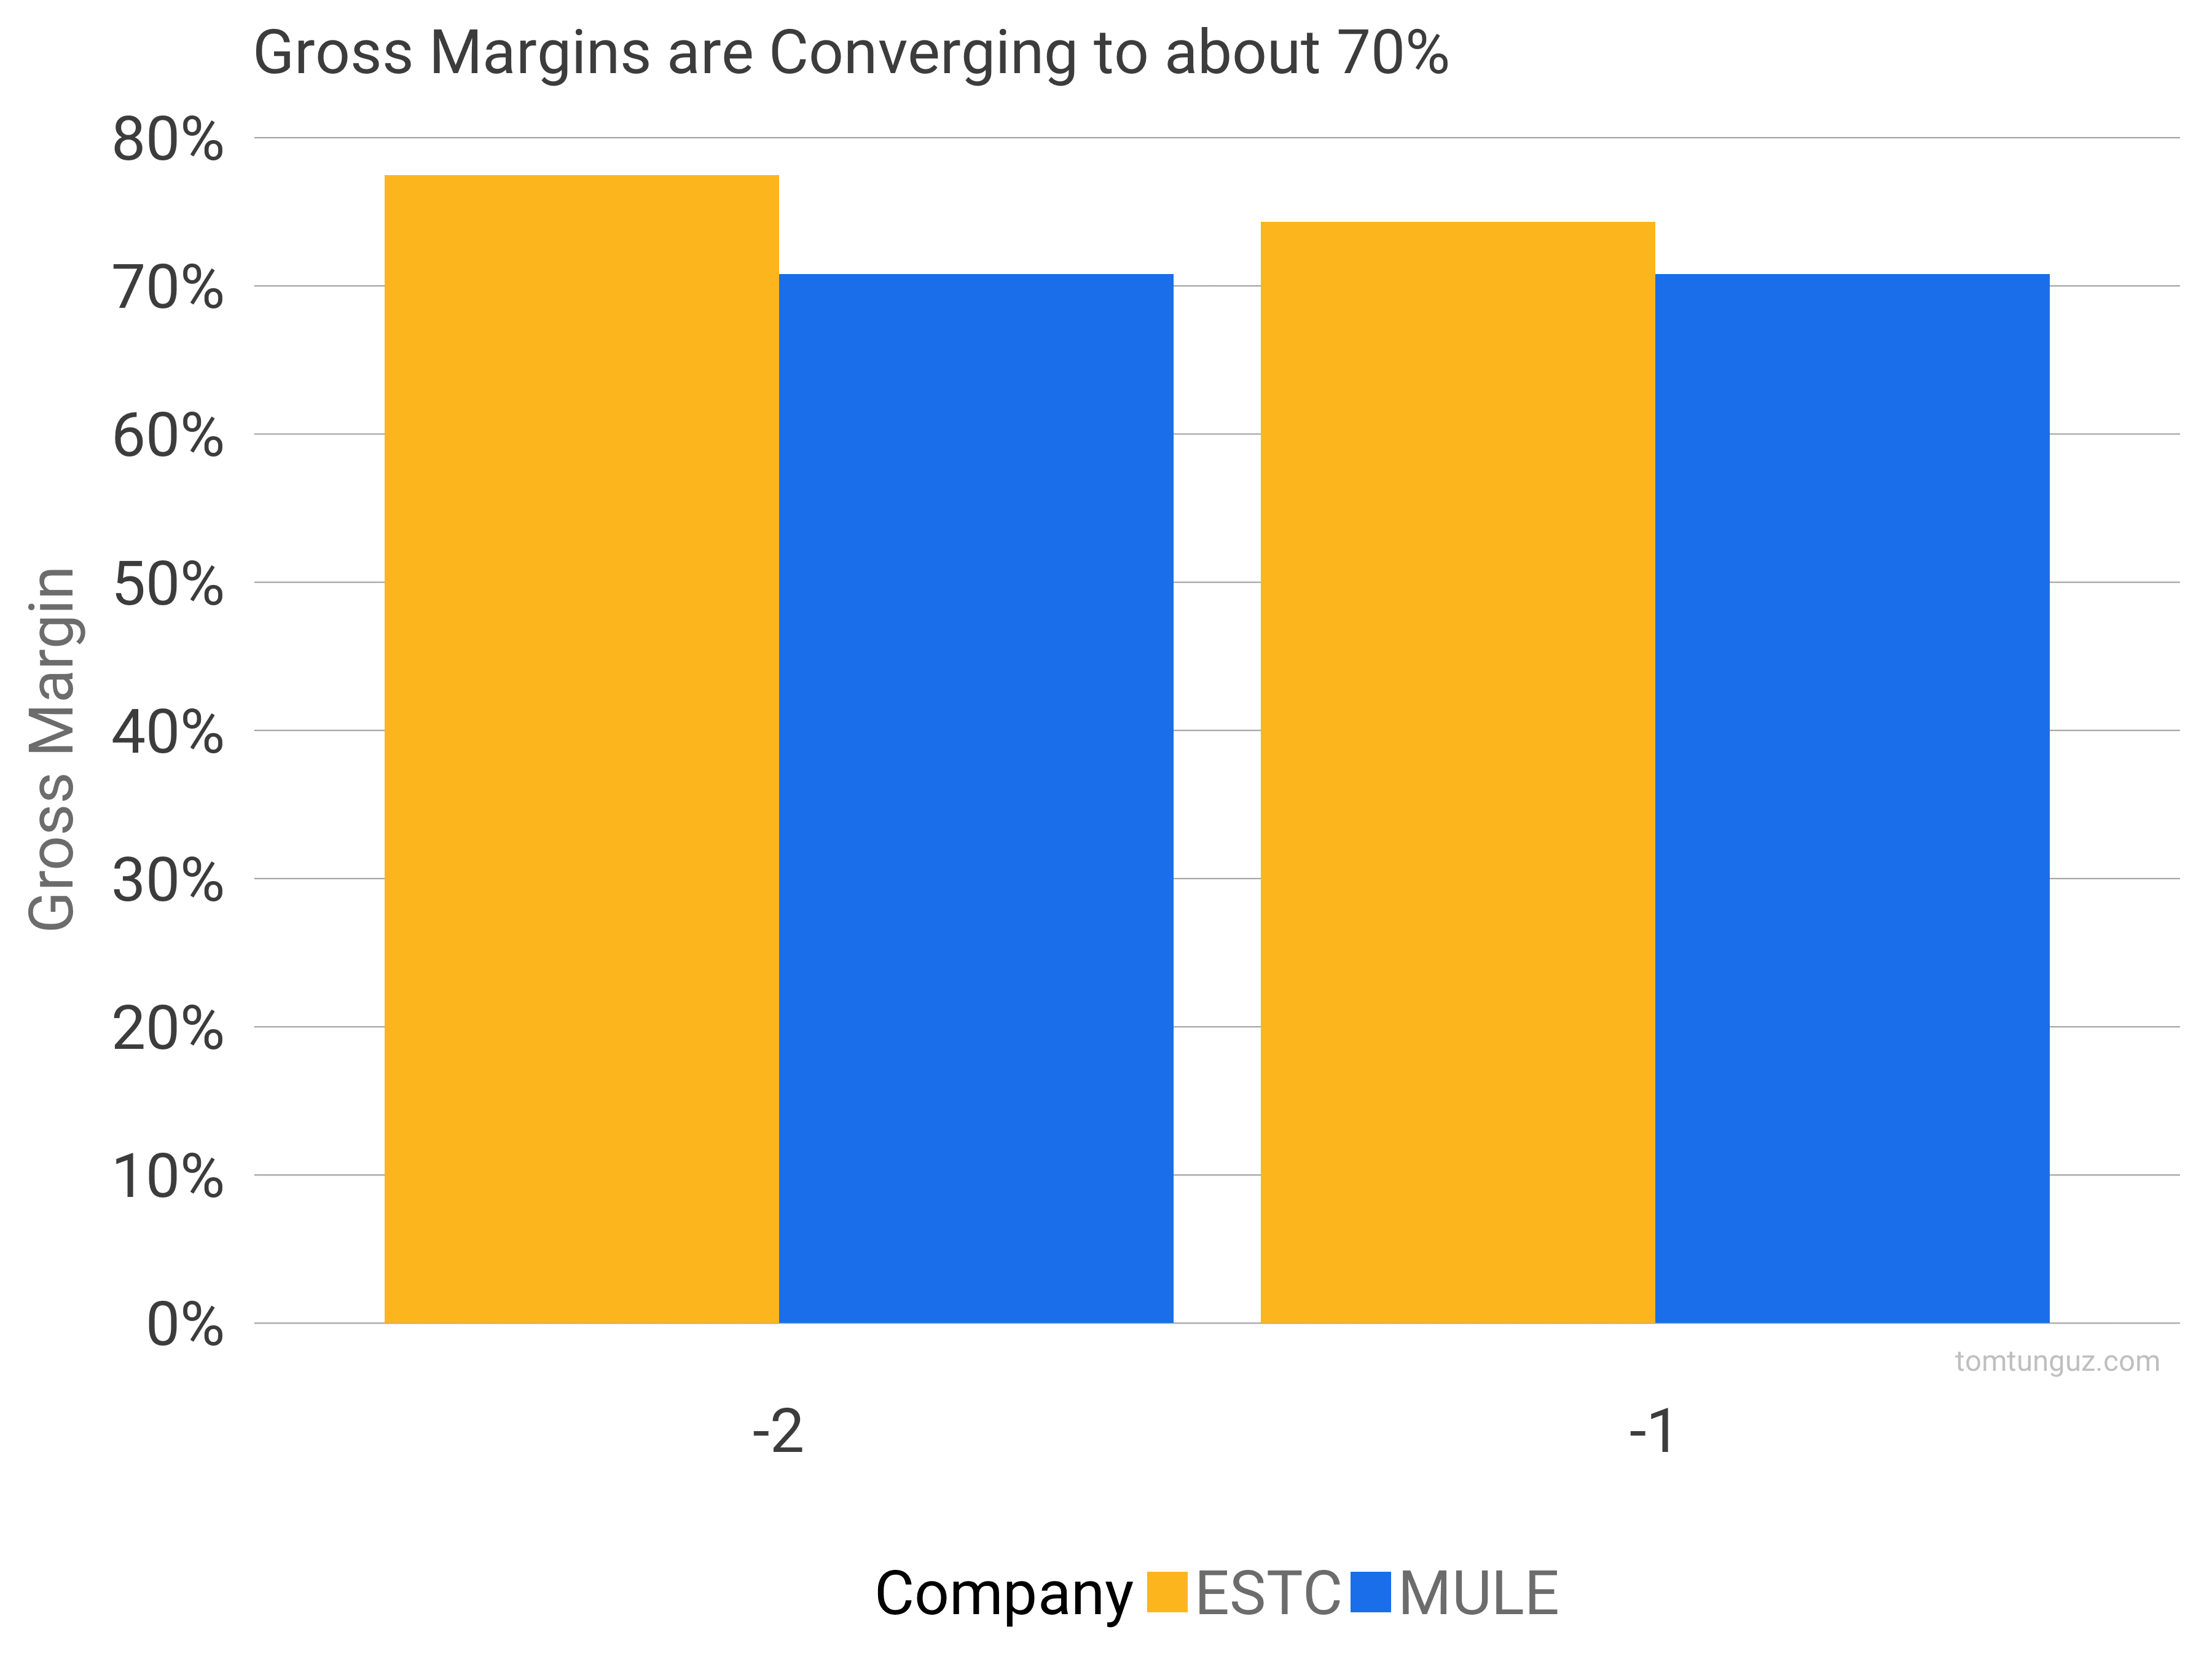
Moving on to gross margin. Gross margin is equal to revenue minus the cost of goods sold which includes things like hosting costs and customer support. The median publicly traded software company is at 71%. Mulesoft is right on the button at 70.1%, while Elastic has been higher but is asymptoting to that figure.
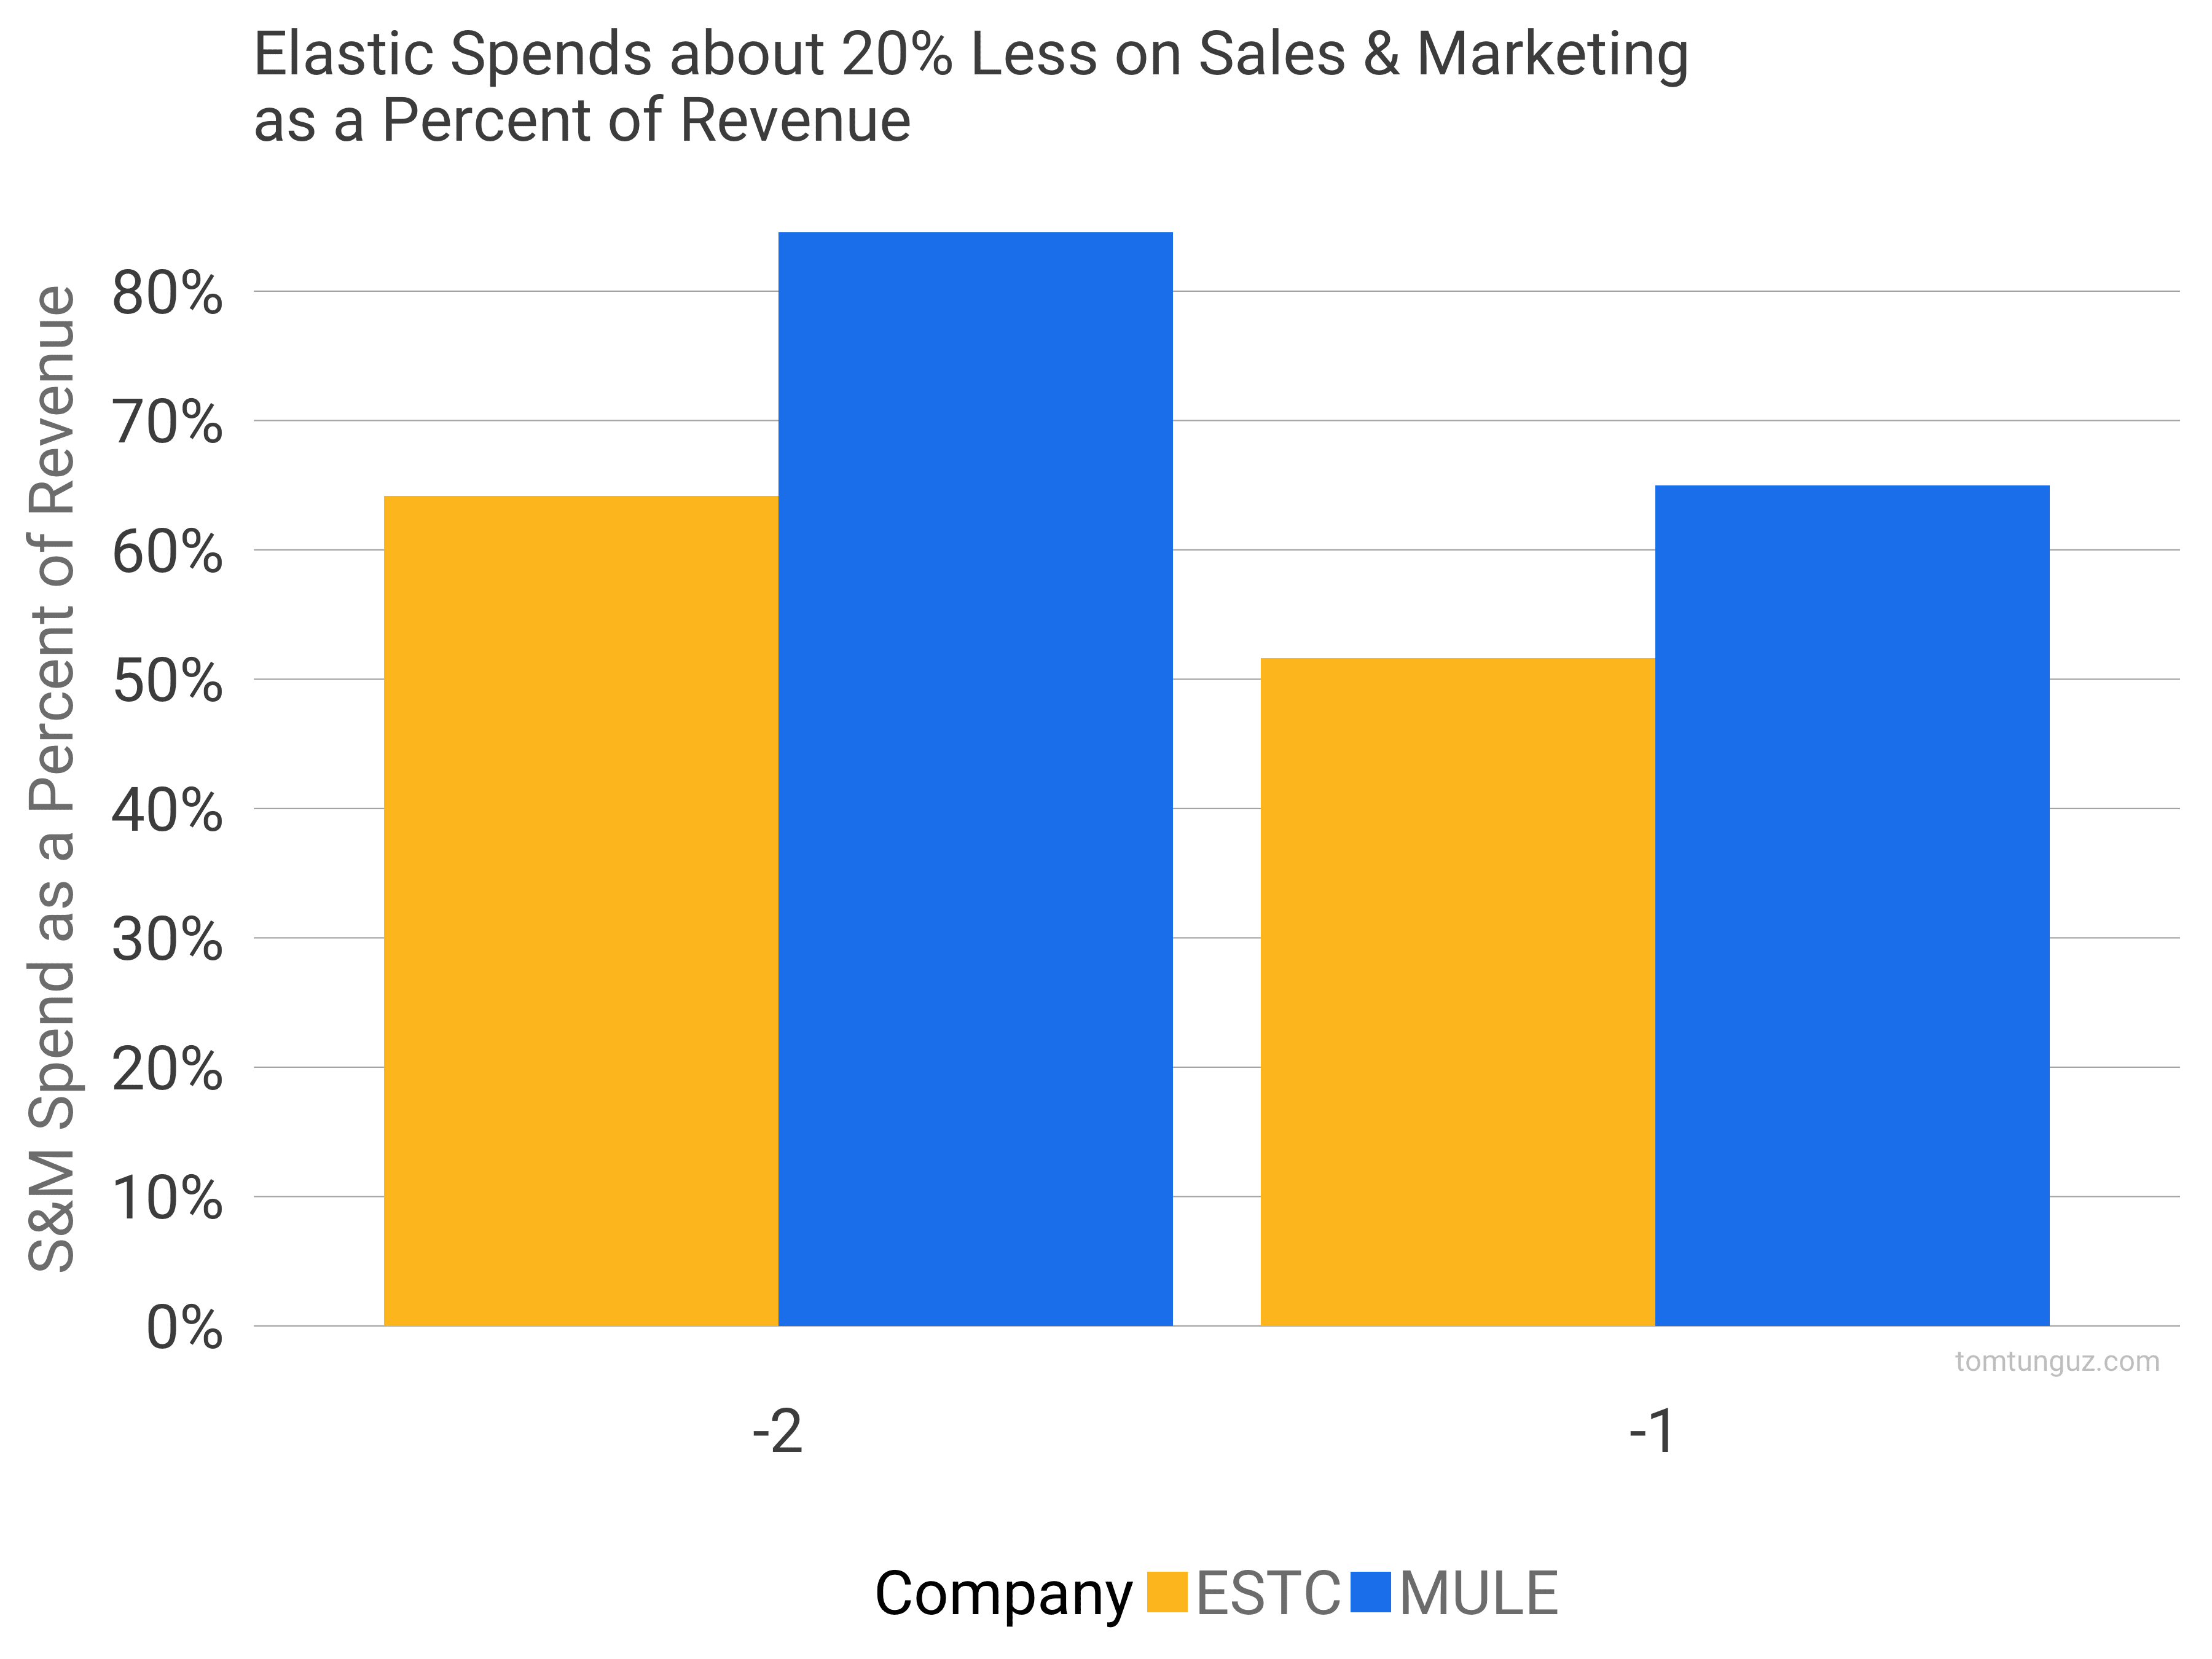
To grow these rates, both companies spend quite a bit in sales and marketing. The chart above shows the sales and marketing spend divided by revenue. Mulesoft invested 85% and 65% of revenue, while Elastic spent 64 and 52% of revenue. This suggests that Elastic’s sales and marketing motion is more efficient than Mulesoft. They spend less as a percentage of revenue on sales and marketing, yet grow revenue nine percentage points faster.
Net dollar expansion is a bit better for Elastic. Mulesoft reported a 1.25x net dollar expansion rate compared to Elastic’s trailing 7 quarters of greater than a 1.3x, and the most recent quarter at 142%. This may have to do with the midmarket focus, which enables greater account expansion, since the company is starting from a lower price point.
The sales efficiency coefficient confirms this. Elastic charts an impressive 0.89, compared to Mulesoft’s 0.65. The sales efficiency coefficient measures gross profit increase over a period divided by sales & marketing investment. In other words how much does the company have to spend in order to generate a marginal dollar of gross profit?
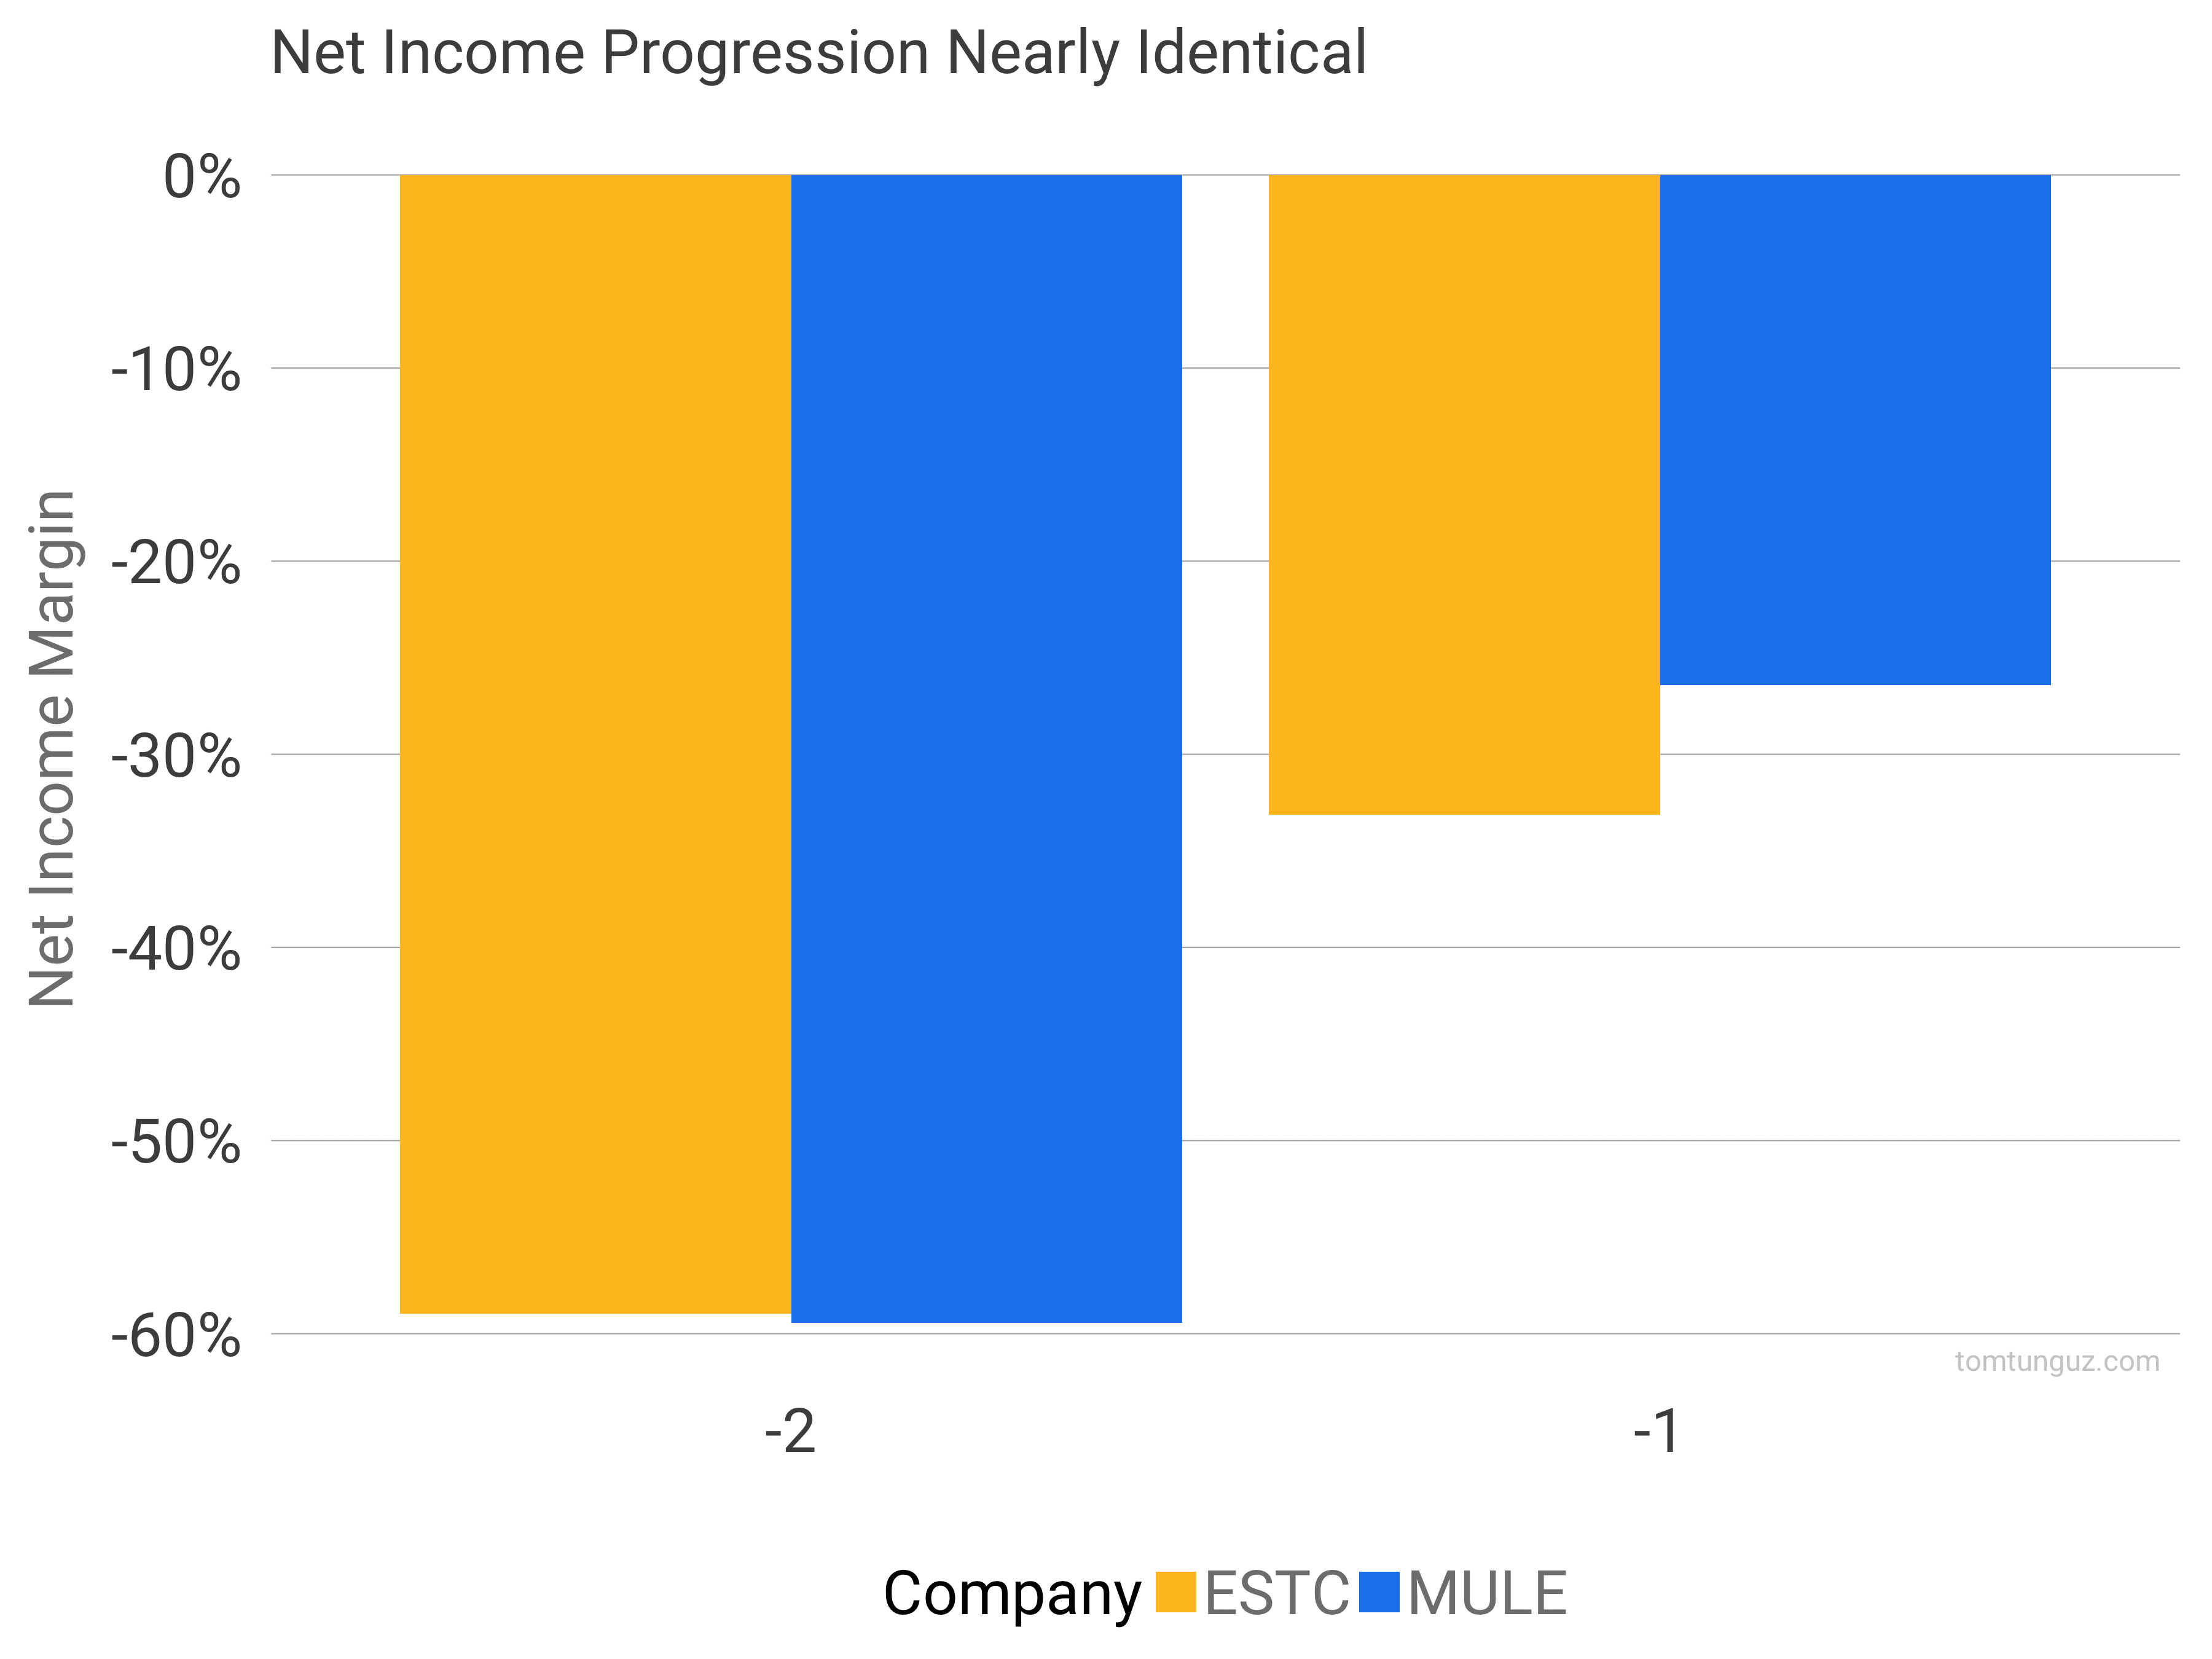
In terms of net income margin, both companies are on effectively the same progression, improving profitability from roughly -60% to roughly -30%.
Elastic is a marvelous business. Another example of the tremendous distribution advantages of open source software, and the sales efficiencies that can fuel the businesses that commercialize open-source software. Mulesoft sold for $6.4B in what was at the time the highest revenue to enterprise value sale for a multibillion-dollar software company. If Mulesoft’s M&A valuation is any indication, Elastic sure to be an absolutely enormous business.