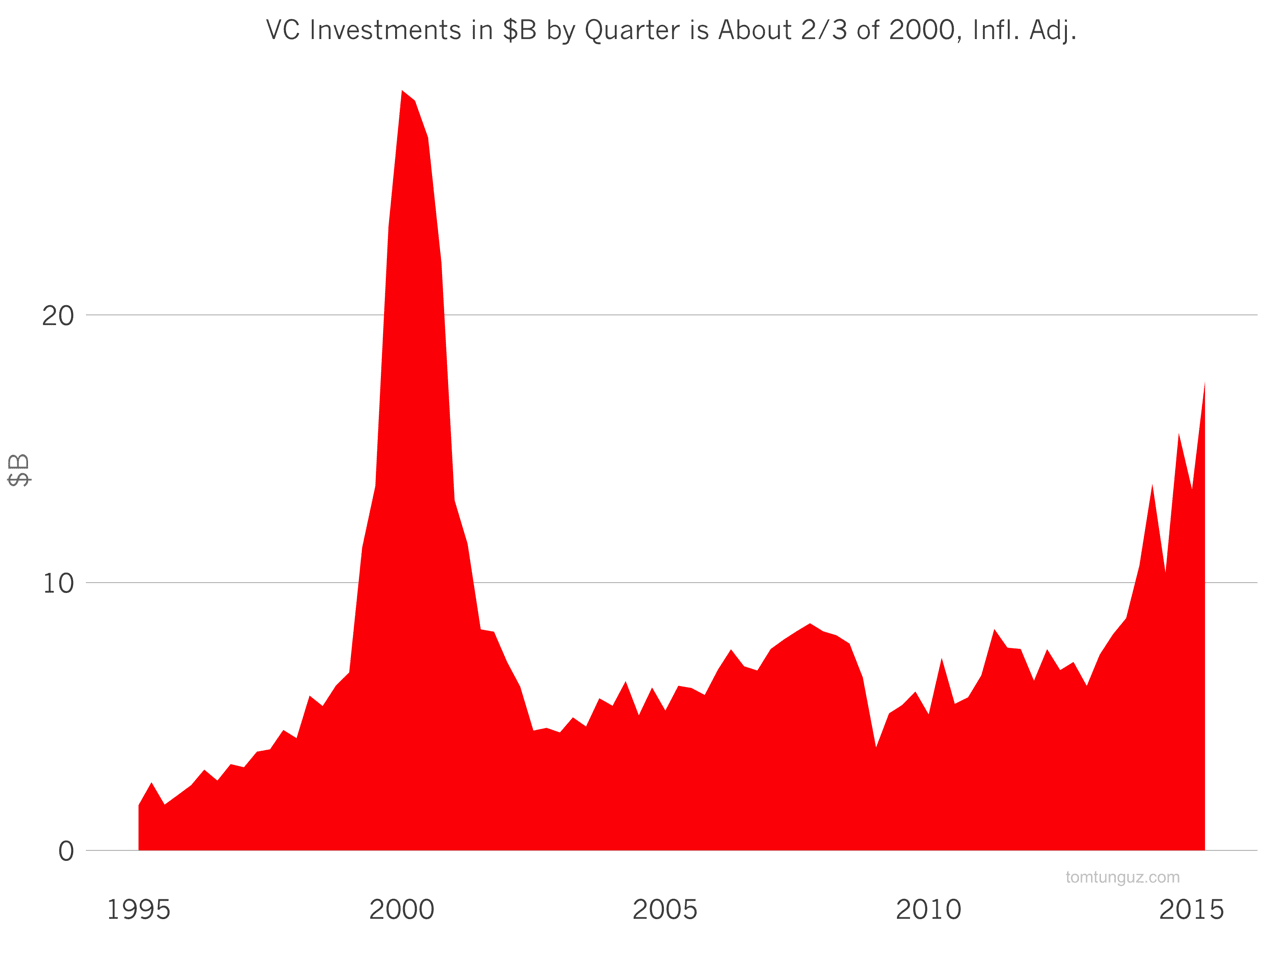
In Q2 2015, VC investment totaled $16.7B, about a 66% of the $28B deployed in Q2 2000 according to a new report. And the trends shows no sign of stopping. A big contributor to this growth are nontraditional investors including mutual funds and hedge funds, which now account for approximately 40% of dollars invested. And while the market is similar to the dotcom era in some regards, it is substantially different in others.
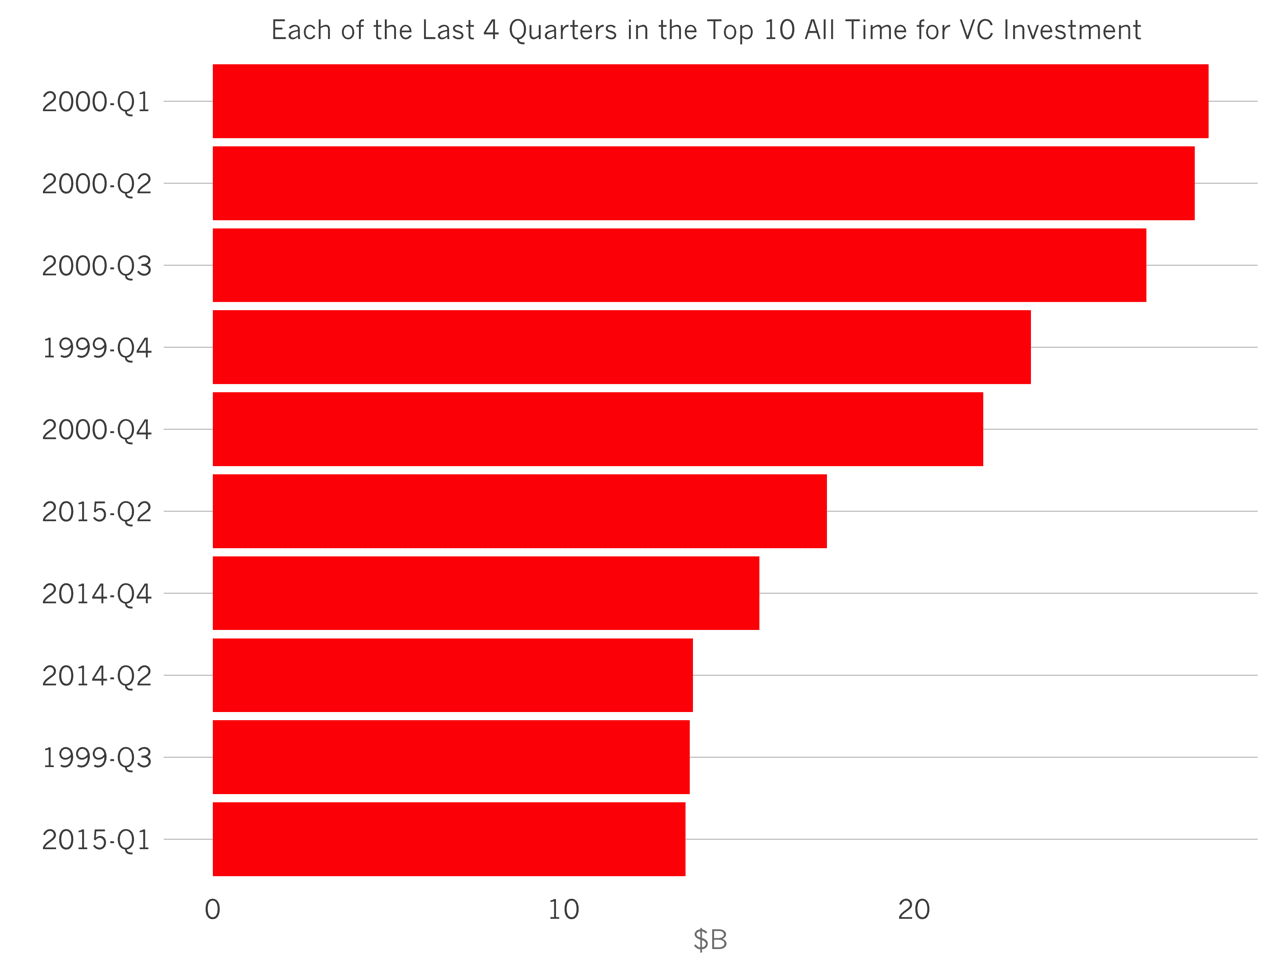
Amazingly, each of the last four quarters of venture investment from Q3 2014 to Q2 2015, are in the top 10 all-time for venture capital investment.
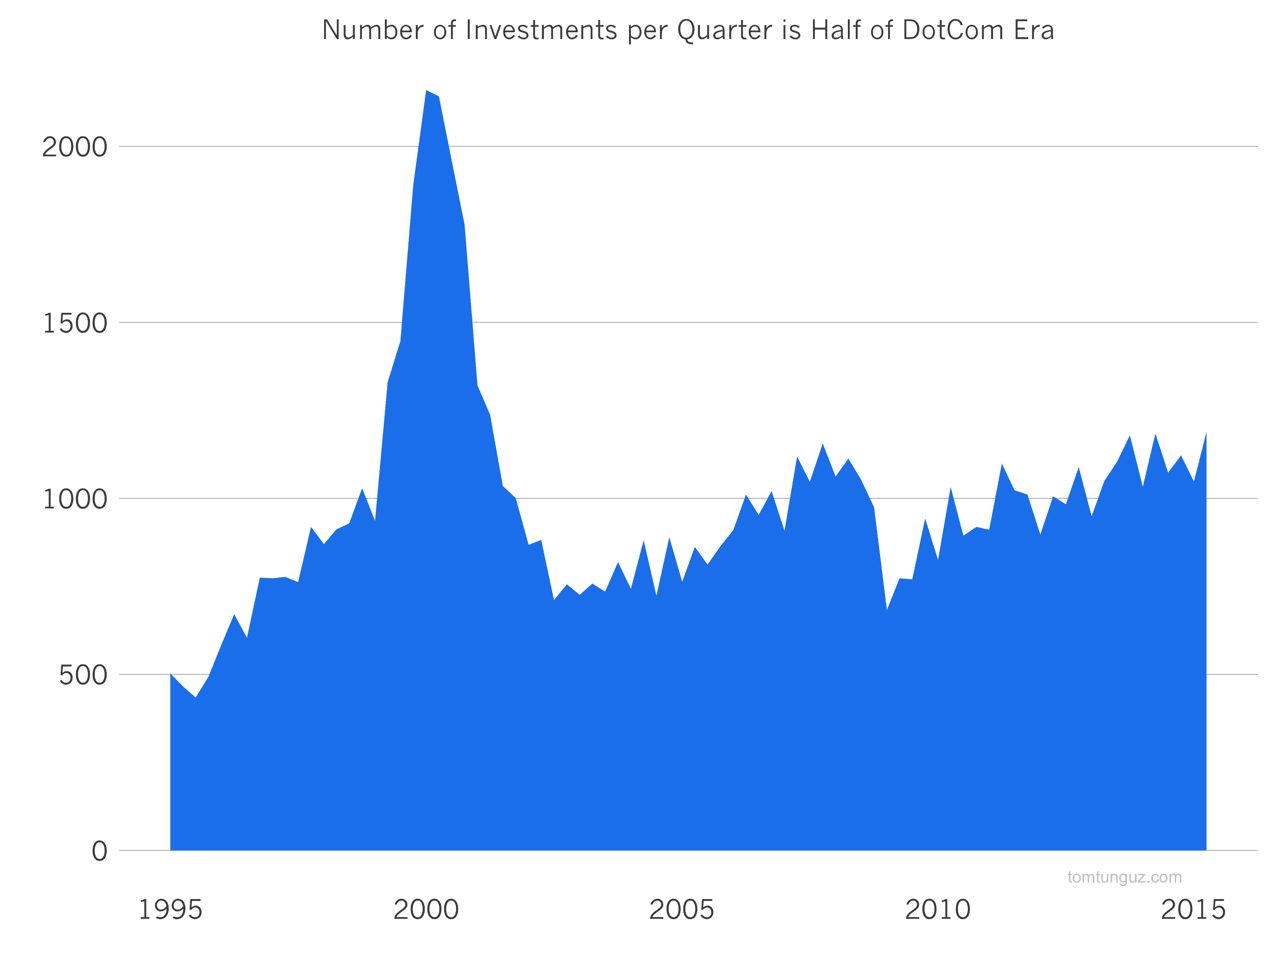
However, the number of investments per quarter is about half of 2000. Combined with the chart above, this implies that fewer startups are raising substantially larger rounds. It also implies that there are probably winner-take-most or similar dynamics in many different industries. Category leaders stockpile massive war chests, creating a defensive moat.
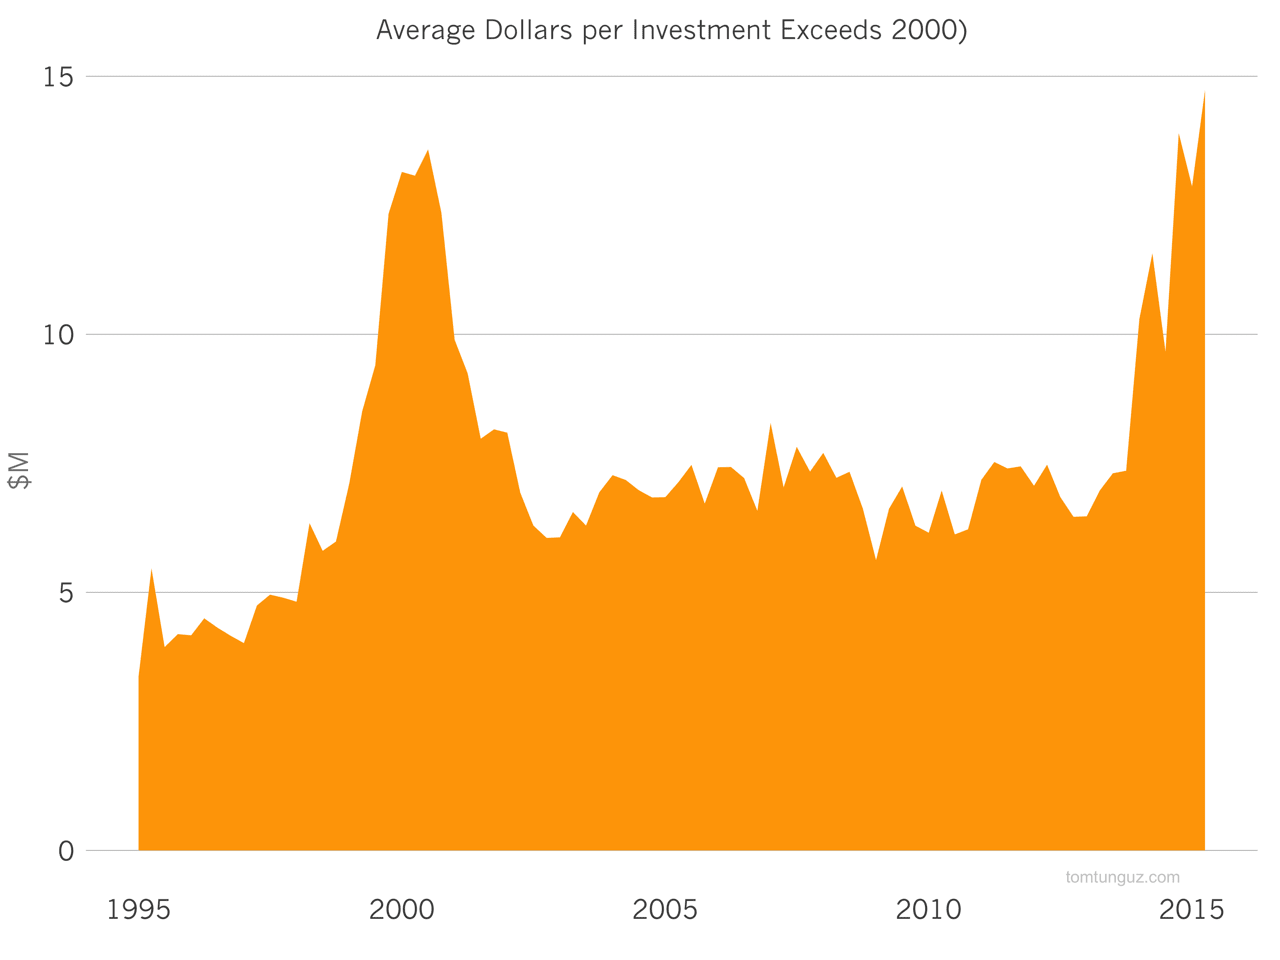
Sure enough, the data shows that the average investment size in Q2 2015 is $14.7M exceeding the $13.1M figure of Q2 2015. In other words, the typical round raised by startups has never been larger.
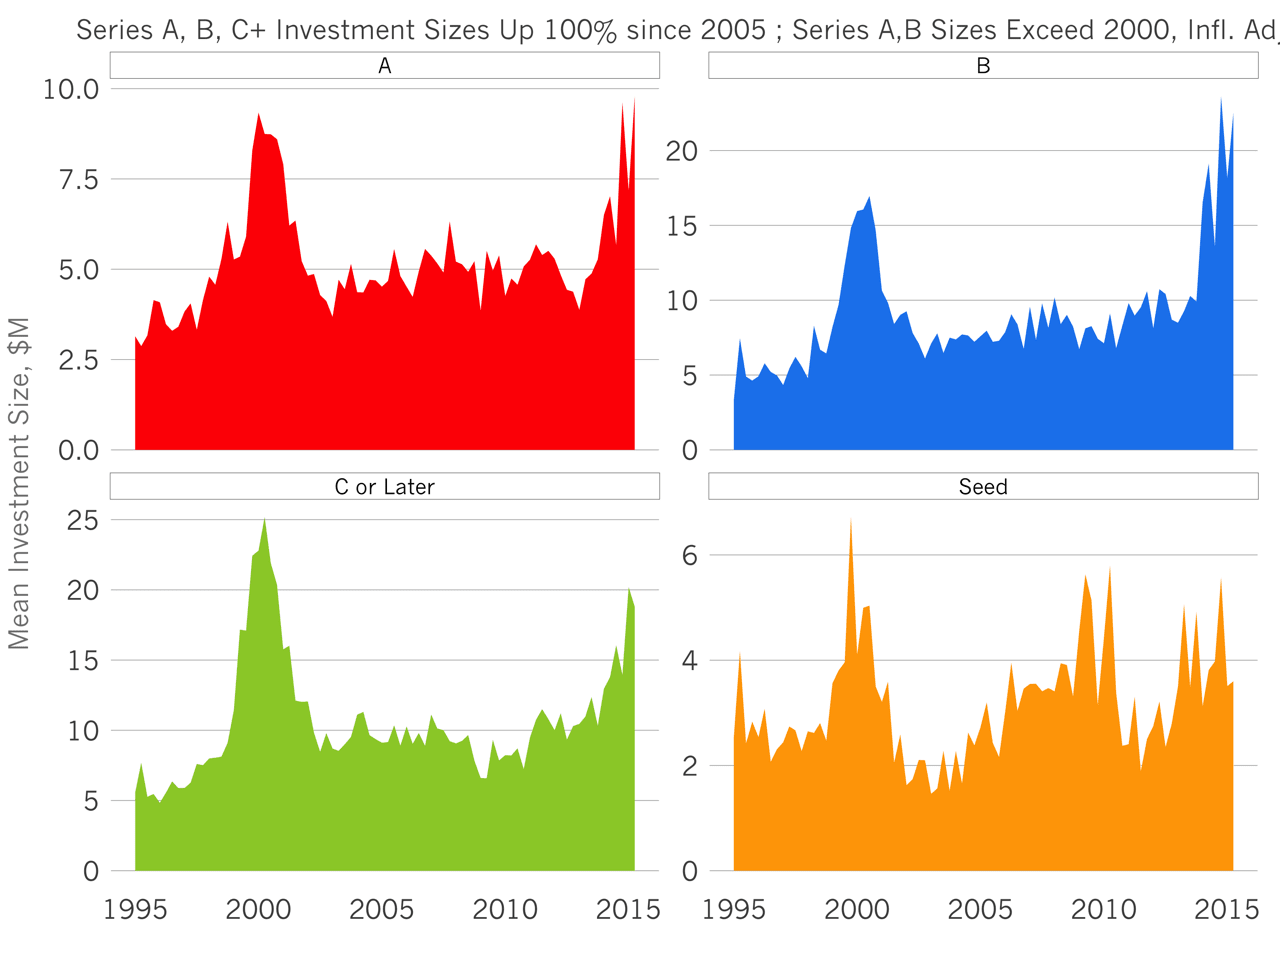
Looking at this data by stage, average series A investments and series B investments are the largest ever been at about $10M and $20M respectively, adjusted for inflation. Later rounds are approaching all-time highs, but have not eclipsed them yet, despite about ten $1 billion plus equity raises in the last 12 to 18 months.
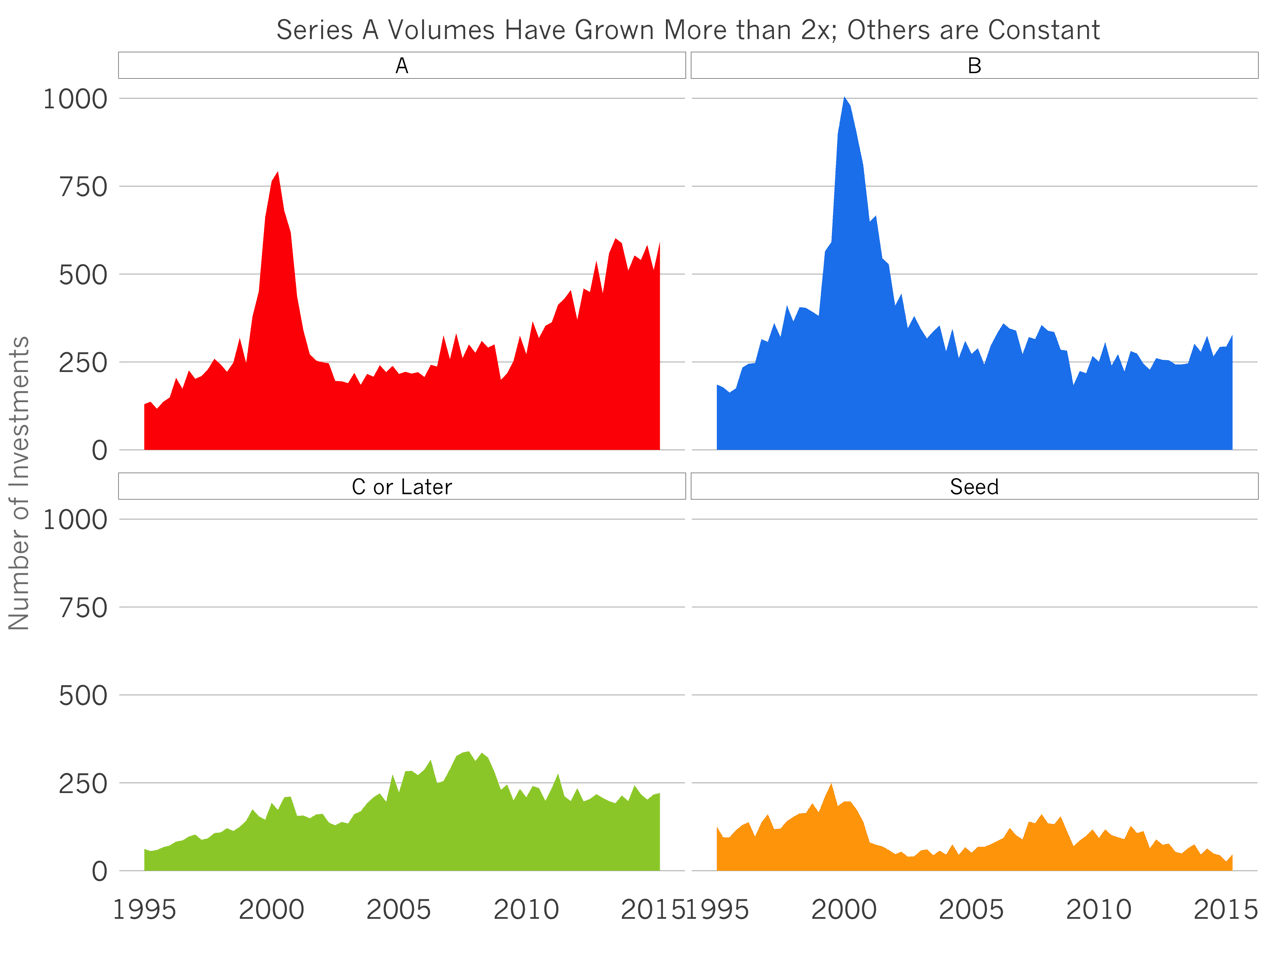
As average investment sizes have increased, and valuations with them, investors have moved earlier in response. Unlike the dotcom era, this time series Bs and series Cs have remained constant in number, while series As have doubled since 2005. Interestingly, seed round volumes have not increased substantially, but this may be an artifact of the way the NVCA collects its data.
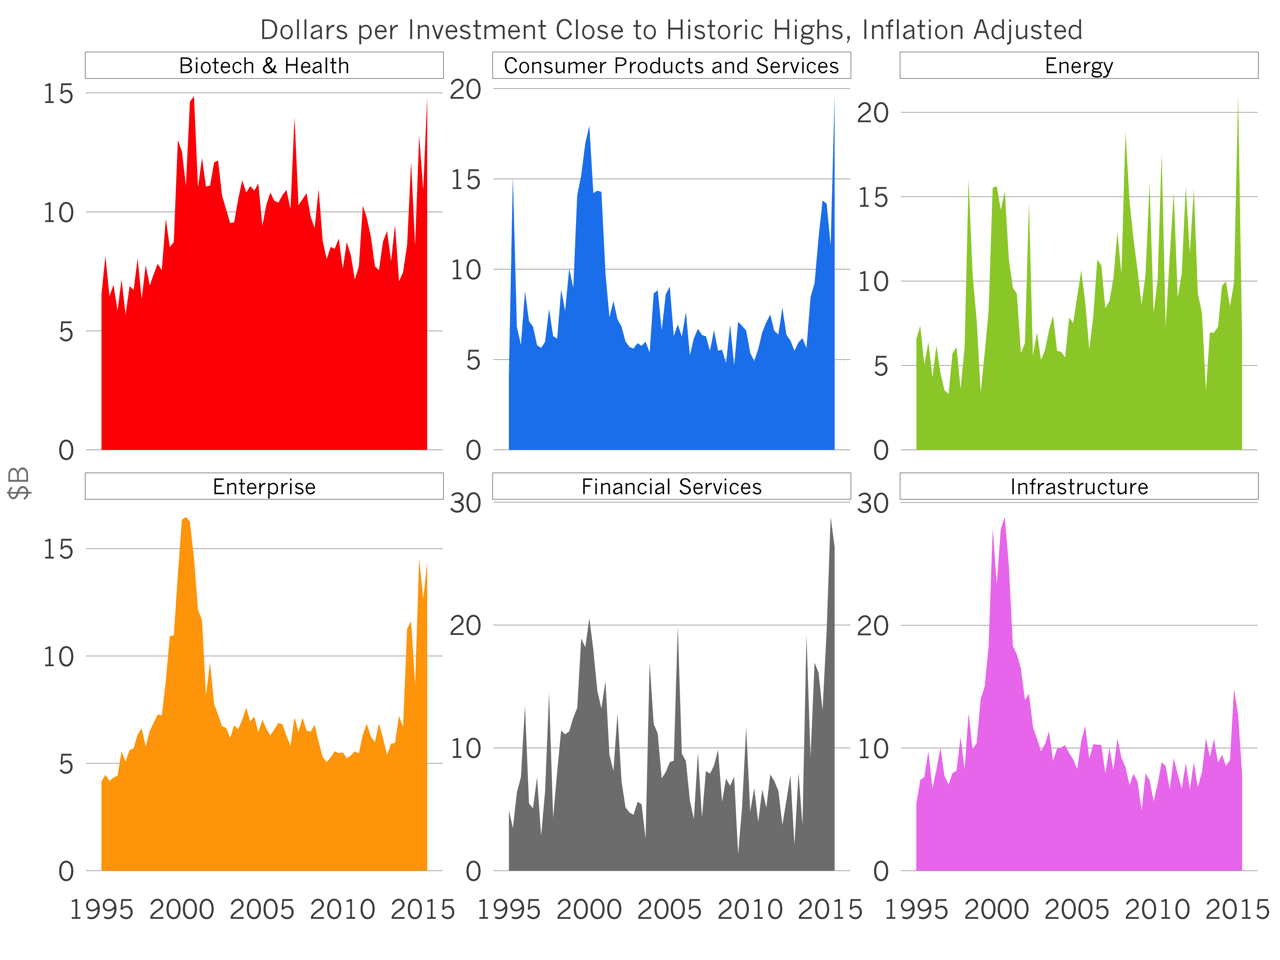
When looking at the data by sector, we see that consumer products and services and financial services companies raise on average the largest rounds. Financial services companies on average in Q2 raised north of $30 million. This is largely skewed by handful of outliers. Consumer products and services also reach close to $20 million.
As the amount of money investors pile into startups starts to reach the levels of the dotcom era, the data shows that while there are some similarities, there also some meaningful differences. This time, investors are pursuing series As more aggressively than they have previously, likely to mitigate the increasing valuations in the market. There is also substantially more concentration in the smaller set of startups. So investors are focusing on the perceived winners of categories.