When we analyzed the impact of location on a startup’s ability to raise capital, we found no statistically significant difference. Startups in San Francisco, Seattle, Pittsburgh, Austin and many other cities all demonstrated similar ability to raise follow-on rounds. But is the same true for investors of various locations? Do investors across the US invest similarly across Seed, Series A and Series B?
They do not. In fact, there is a statistically significant difference in investment patterns of investors depending on their location. The table below contrasts the mean round sizes across Seed, Series A and Series B, by investor headquarters location across firms in California, Massachusetts and New York1.
| Round Sizes in $M | CA | MA | NY |
|---|---|---|---|
| Seed | 1.1 | 1.1 | 1.1 |
| Series A | 5.8 | 6.1 | 5.0 |
| Series B | 13.3 | 11.3 | 12.8 |
| Lowest Statistically Different Values Marked in Red | |||
Investors in these three states invest similarly at the seed stage. But New York investors write 16-22% smaller Series A checks than their counterparts in CA and MA. Massachusetts investors invest 13-18% less than New York or Californian investors in Series B. T-Tests in both cases produce p-values of 0.0002 or smaller, indicating the values are statistically different.
First, let me debunk a fallacious conclusion, that founders should raise Series As only in CA and MA, and Series Bs in CA and NY. While there are differences in the average investment size, the two charts below illustrate investors in each of these three geographies underwrite investments of all sizes. The major difference across markets is the relative frequency of smaller and larger investments in aggregate. In certain geographies, investors in aggregate are likelier to underwrite larger investments.
To convey this point about investment frequency, I’ve plotted the distribution of investment by size for the three different investor states in Series As and Bs. It’s plain to see investors in each of these three geographies have underwritten investments of all sizes, but the relative occurrence of different round size varies by state.
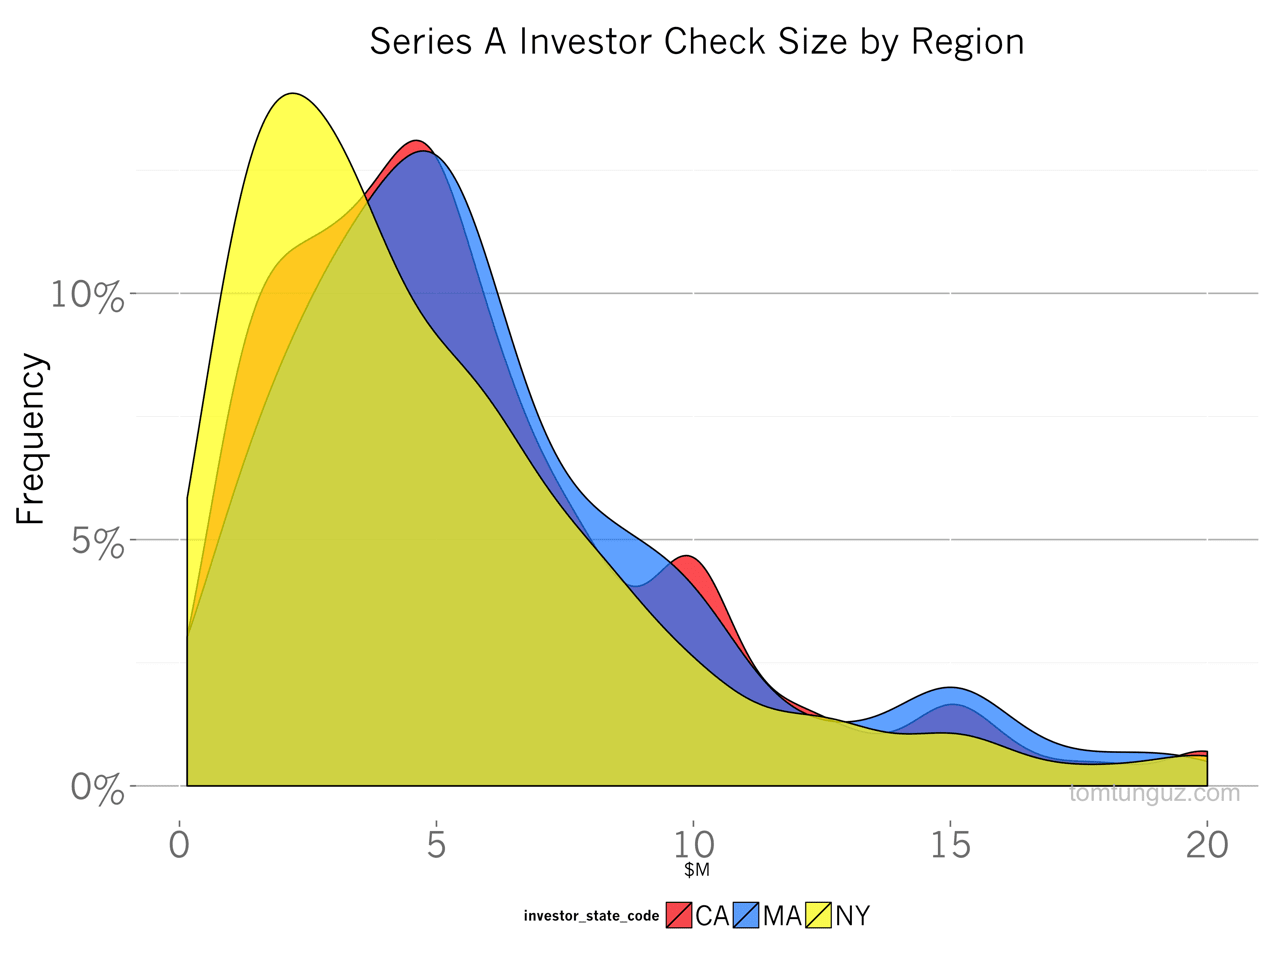
The chart makes plain NY-based investors’ preference for smaller Series As . The yellow curve indicates the most common Series A round from NYC-based investors is around $3M compared to $5M in CA and MA.
Interestingly, Series A investments by California and Massachusetts firms display spikes at $5, $10 and $15M, indicating these round numbers have become de facto standard investment sizes. More importantly, it implies entrepreneurs are able to negotiate investment size not based on the cash needs of the business, but perceived value of the company.
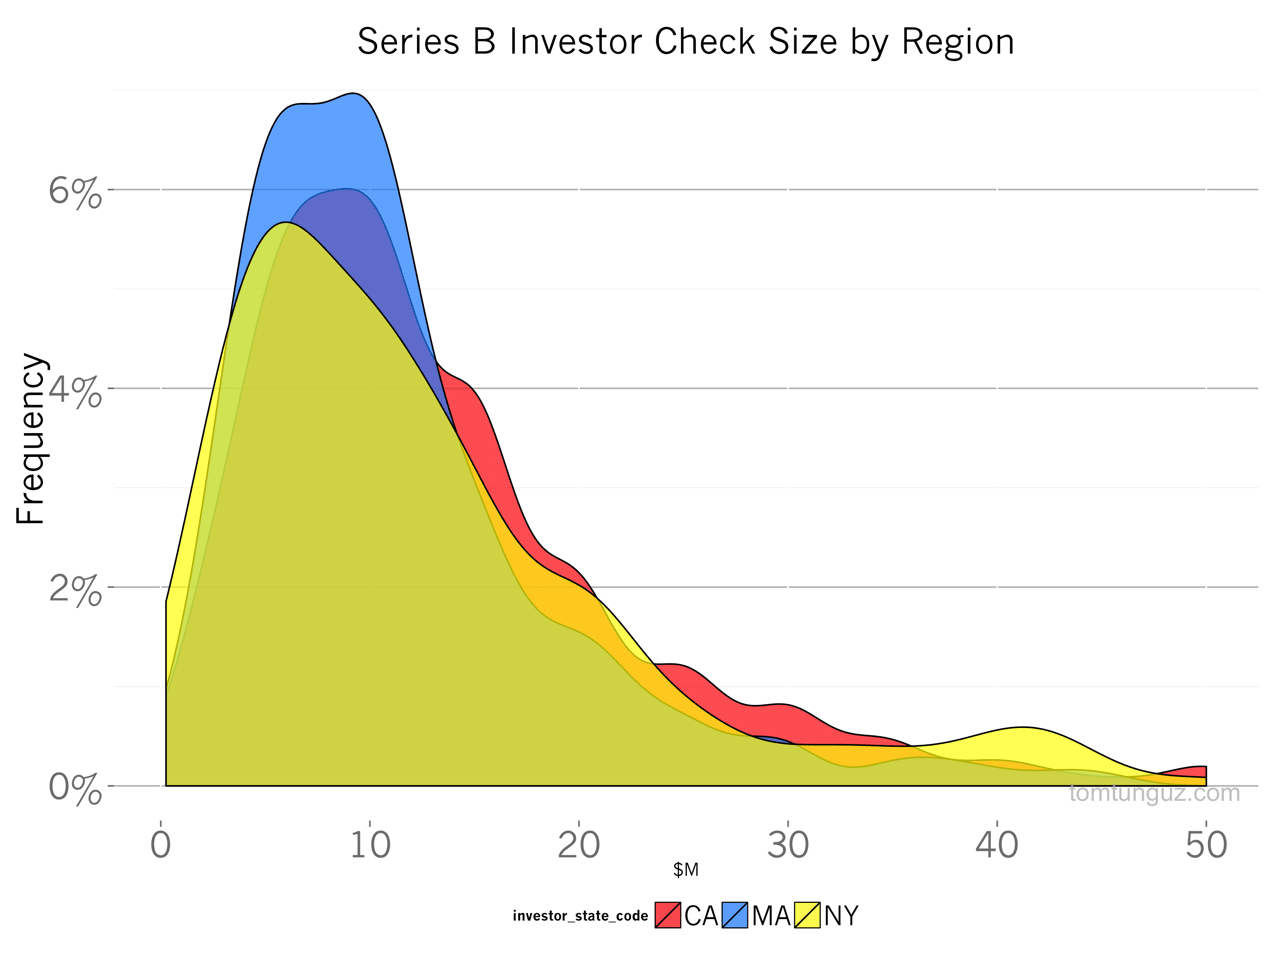
A parallel chart for Series Bs demonstrates a unique different investment behavior by MA investors who invest much more frequently in smaller Series Bs. Curiously, NYC based investors tend to write more $40M+ checks on a relative basis than either MA or CA investors.
These differing investment patterns may have many causes. NY investors may be writing Series A term sheets at earlier stages in startup life-cycles; and the same might be true in Series Bs for Boston investors.
Startup sectors may be more or less in vogue in certain cities and different sectors may have wildly different capital needs. For example, local delivery companies and ecommerce companies tend to require more capital than others because they generate substantially smaller gross margins than most enterprise companies, increasing the required round size.
There may be more competition in certain rounds in particular regions because firms in that region have decided to focus on Series As or Bs; there may be a different distribution of fund sizes by state.
Or it could be regional difference in terms such as pre-money valuations, ownership thresholds, or employee stock option plan sizes.
Whatever the cause, the data should encourage founders to ensure the firms they might engage in fundraising talks have underwritten similar investments to the type the company would like to raise. And the data also supports the idea that soliciting terms from investors across geographies is the best way to obtain market price for their equity.
1 I’ve used Crunchbase data for this analysis from 2011 through October 2014. Crunchbase attributes investments made by multi-geo funds like Bessemer, Matrix, CRV to only one geography, in this case, CA, CA and MA repectively, which introduces some noise into the analysis.