This post is part of a continuing series evaluating the S-1s of publicly traded SaaS companies in order to better understand the core business and build a library of benchmarks that might be useful to founders.
New Relic is San Francisco based, 534 person company providing tools for engineers to understand how well their code is performing. The company operates in the Application Performance Management category, which New Relic calls Software Analytics. Engineers insert code into their applications which sends data to New Relic’s servers. New Relic processes this data and provides interactive reports to identify underperforming code. New Relic charges by the server - the more computers monitored, the greater the subscription fee. Today, the company counts 250,000 users and 10,590 paying customers. An interesting sidenote: the name New Relic is an anagram of the founder’s name, Lew Cirne.
In the next seven charts, we’ll explore how New Relic built their business. We will explore revenue growth, average revenue per customer, sales efficiency, payback periods, net income, gross margin and engineering spending. In these plots, I’ve used New Relic’s colors as a consistent legend. New Relic company data is teal, median values are black, and other company values are gray. All the data come from New Relic’s S-1.
If I were to use only one chart to summarize why New Relic has built an amazing business it’s the following one which shows the annual revenue growth rates of New Relic customer accounts.
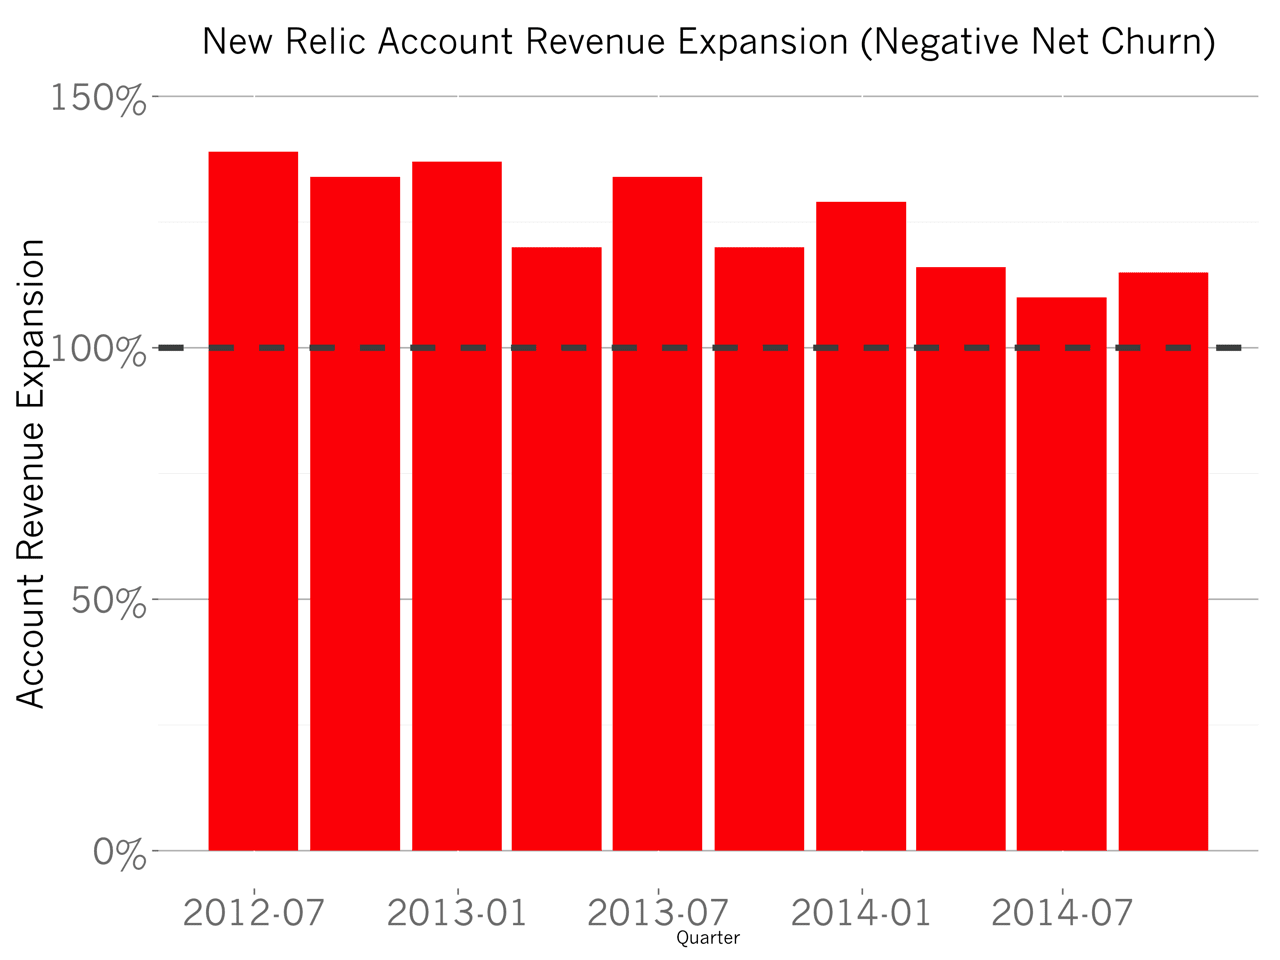
Each year, the typical customer pays New Relic 14% more than last year. In industry parlance, this is called negative revenue churn. Negative churn an incredibly attractive attribute of a business because it means if the company were to cease spending money to acquire new customers, the business would still grow at a 14% CAGR.
New Relic achieves negative revenue churn because customers instrument increasing numbers of servers over time, which costs more. The longer a customer uses New Relic, the more they become accustomed to developing with all the product’s insights, the more servers and applications they will migrate to New Relic’s analytics system.
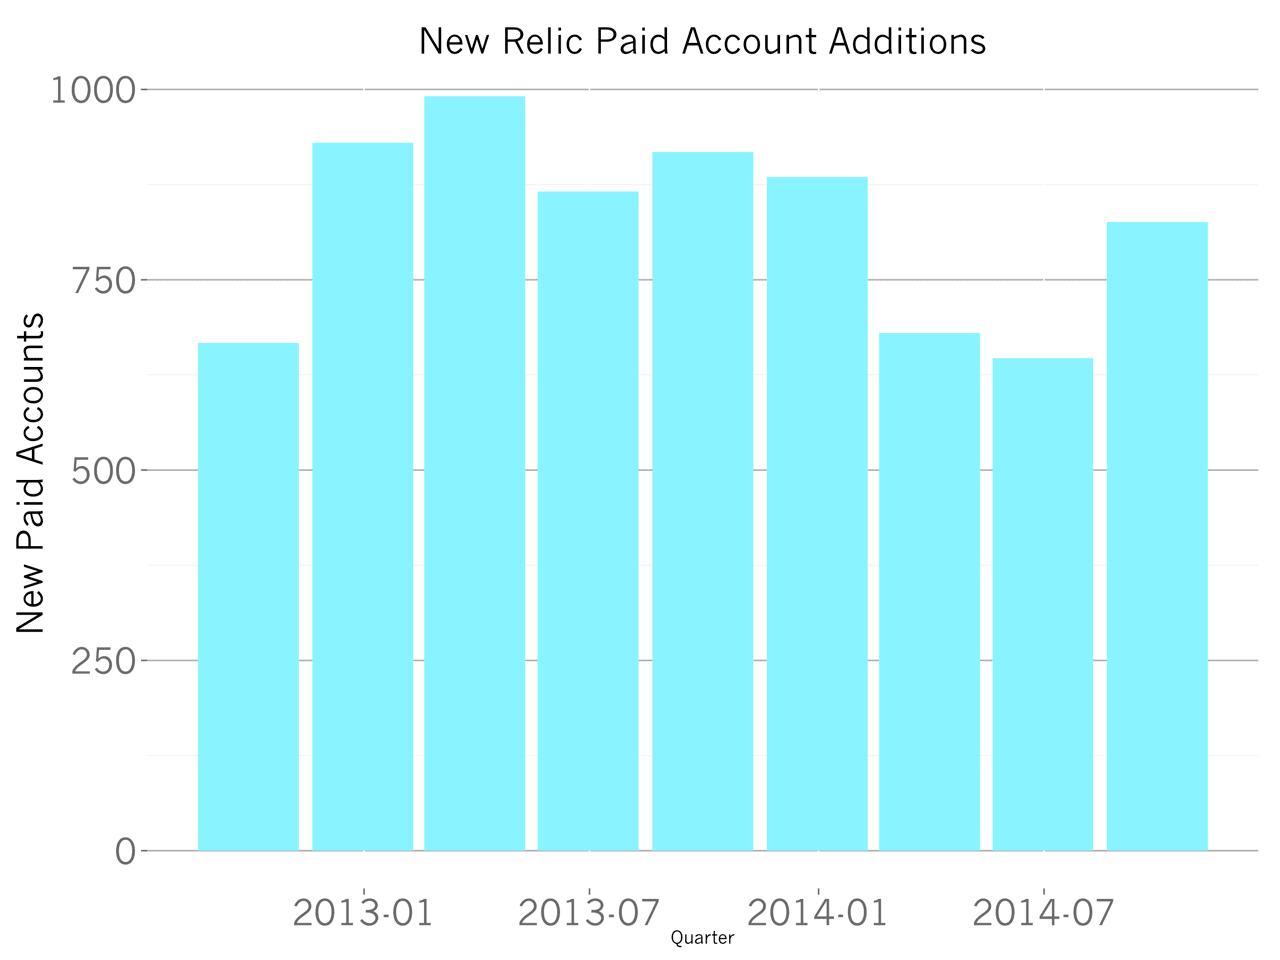
So despite relatively flat new account acquisition numbers which have remained at about 750 per quarter, New Relic’s revenue will continue to expand because of the negative churn characteristic.
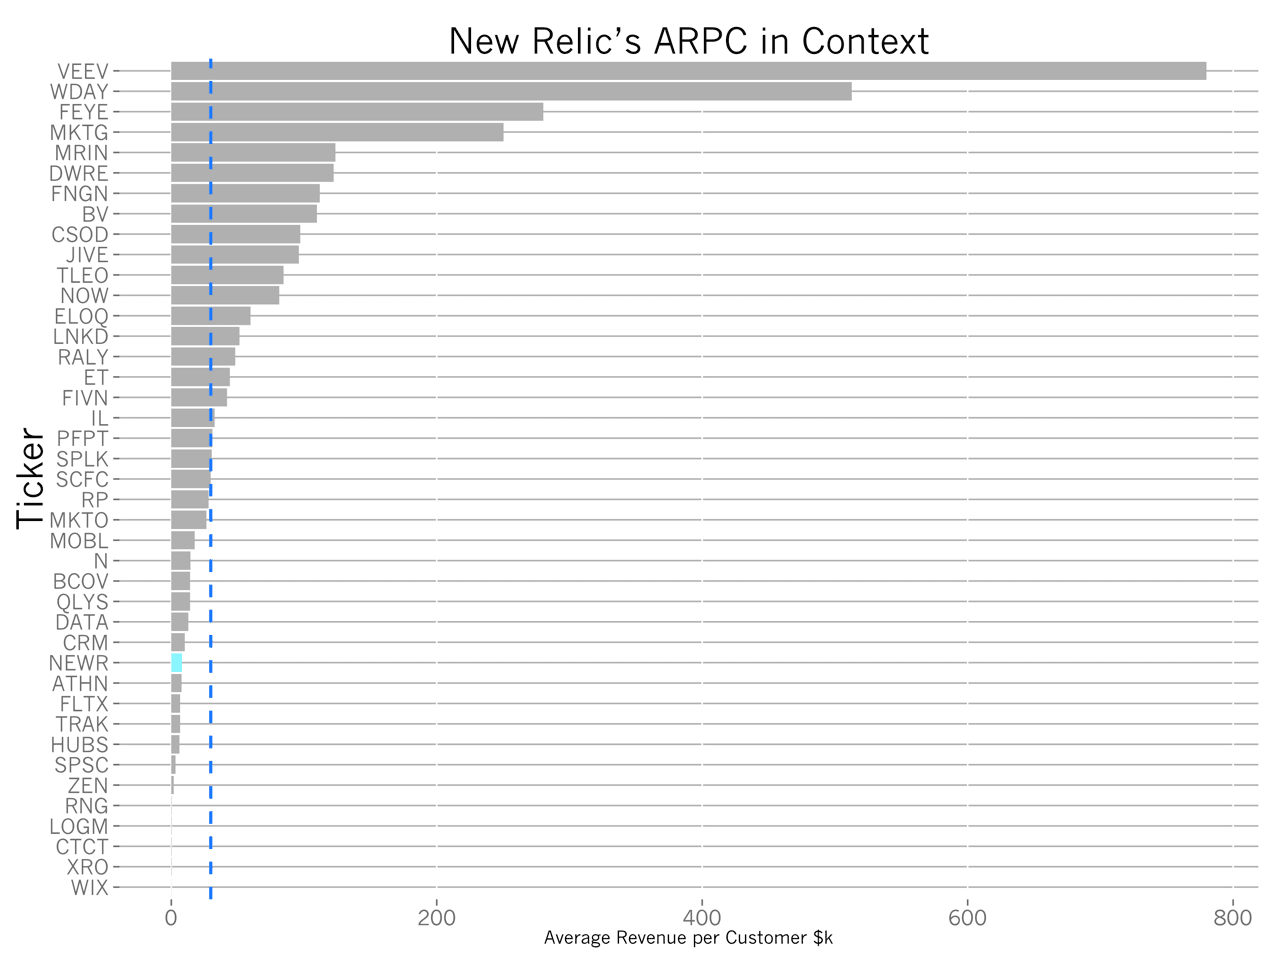
As the S-1 indicates, in addition to the smaller accounts that likely form the majority of the company’s customer base today, New Relic is pursuing larger customers. At the time of the S-1, the company recorded an Average Revenue per Customer of about $8k. This will surely increase as the company penetrates engineering teams more deeply and the investments in sales and marketing begin to reward the company with larger contracts. But this account size easily supports building an inside sales team to scale revenue quickly.
Another aside: the majority of New Relic customers pay on a monthly basis, unlike most SaaS companies which move to pre-pay annual contracts. Many SaaS companies move to annual pre-pay to be able to finance their own growth more efficiently and to reduce churn. But churn doesn’t seem to be a concern for New Relic. Storing data for their customers provides the business some lock-in.
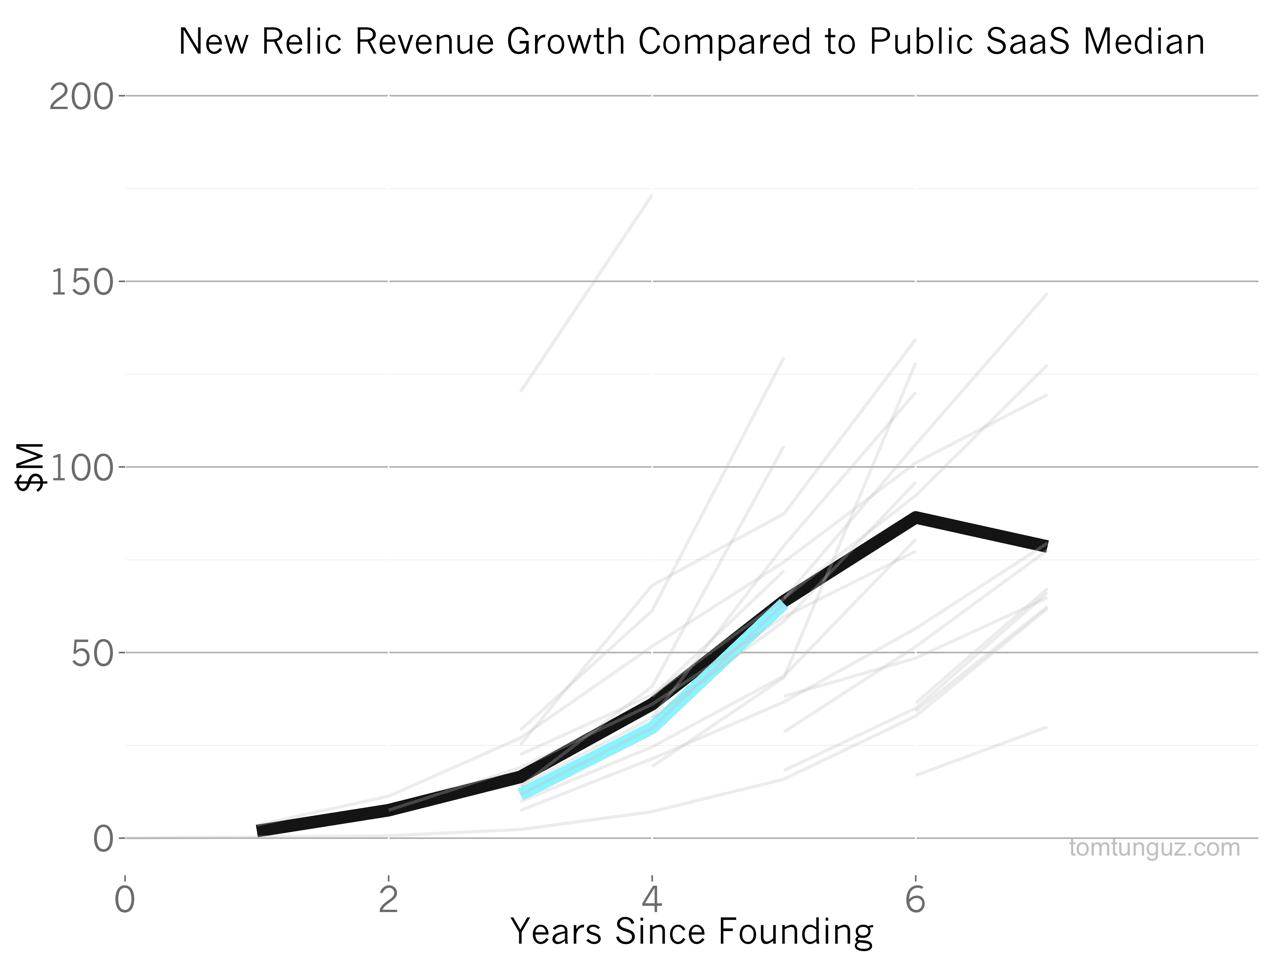
The combination of negative churn, account growth and pursuit of larger accounts has enabled New Relic to grow rapidly. The company reported $63M in trailing twelve months’ of revenue in their 2014 fiscal year which is right at the median. Impressively, New Relic increased revenue 213% y/y.
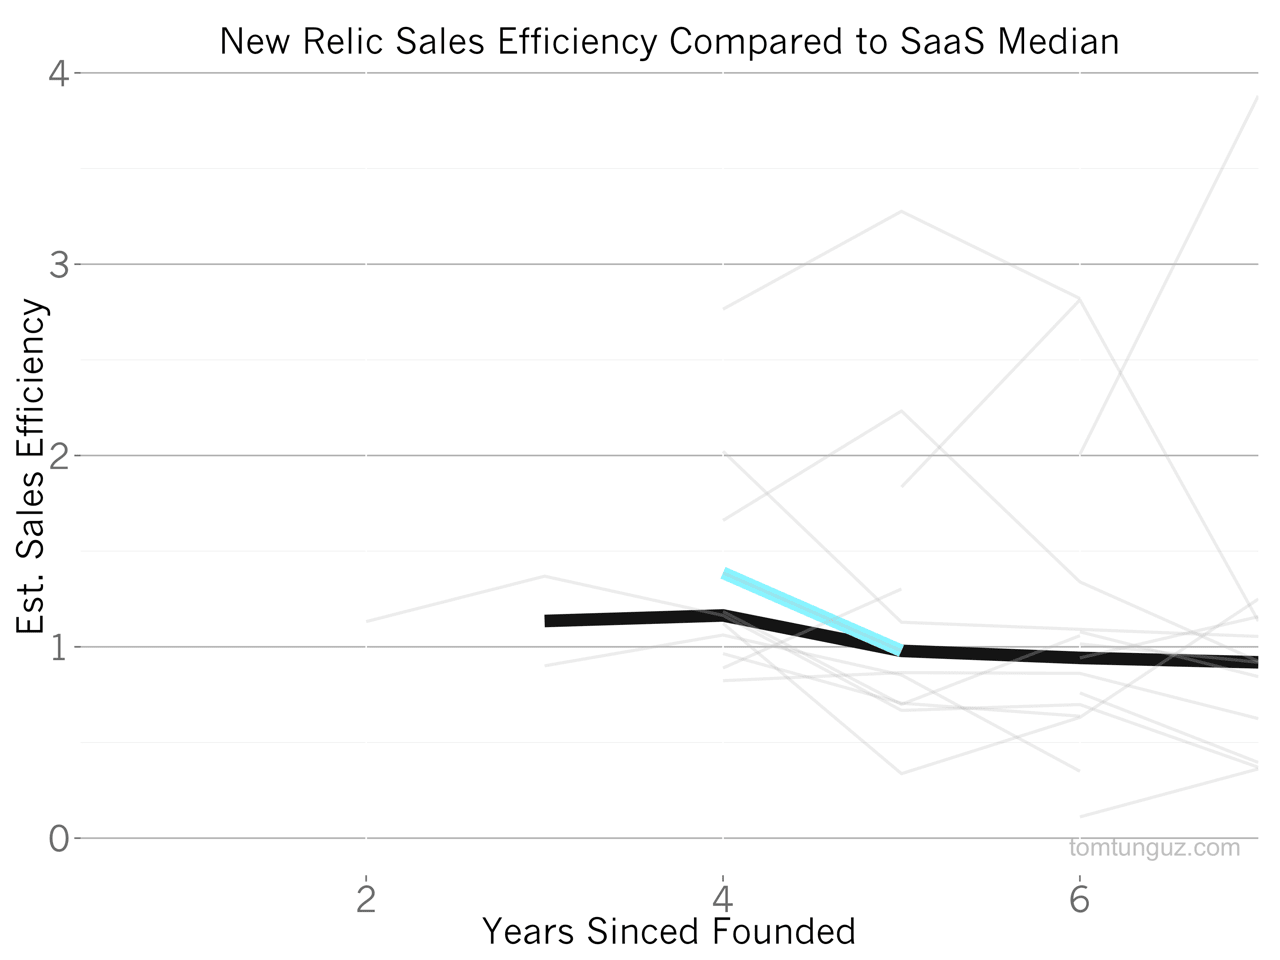
New Relic’s sales efficiency has historically been higher than the median at 1.4, but recently that figure fell to 0.98 as the company tripled its spending on sales and marketing from $10.7M to $28.4M. The S-1 indicates the company is expanding rapidly in EMEA and APAC, in addition to the US, all of which requires marketing spend and building sales teams.
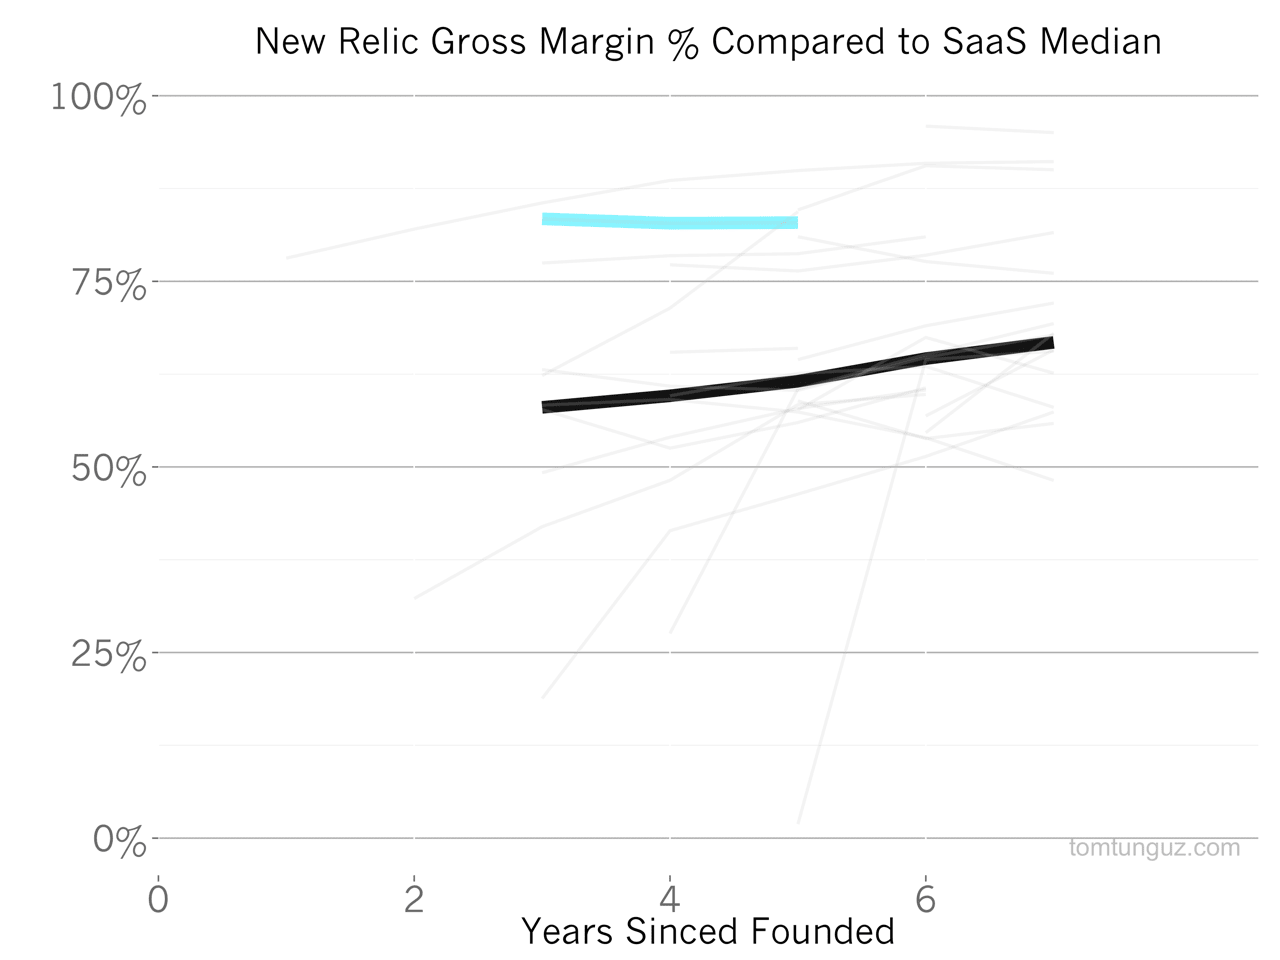
Here’s another impressive chart. New Relic’s gross margin has hovered at 83%, an amazing 25% better than the SaaS median. And this gross margin has been constant for at least the past 3 years. Gross margin is revenue minus cost of goods sold. In this case, New Relic’s main costs are storage and customer support/success. The incredible consistency of the gross margin might indicate the company actually manages pricing to this metric.
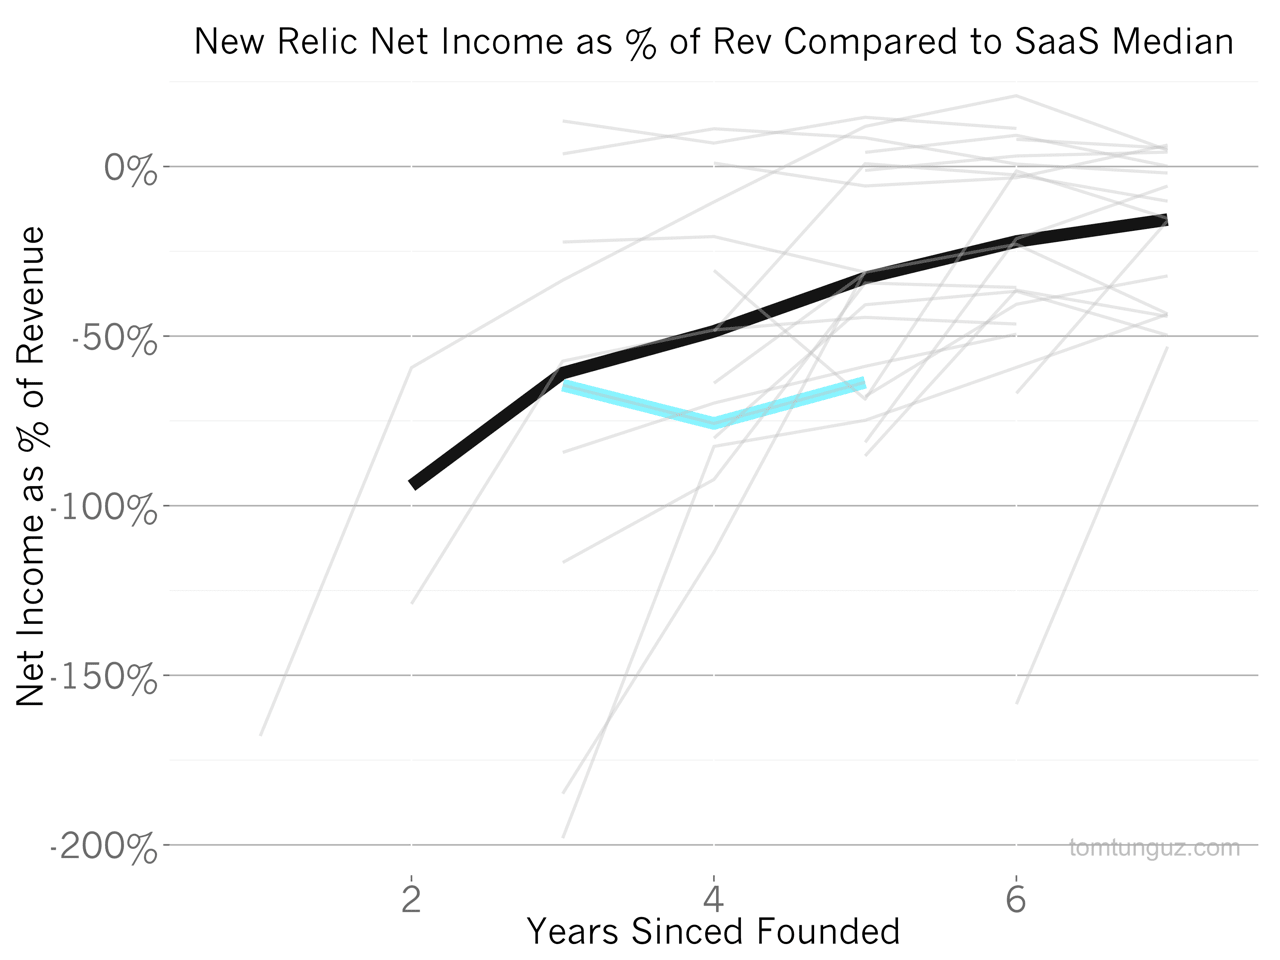
New Relic burns more capital as a percentage of revenue than the median publicly traded SaaS company. Over the last three years, the business has operated at -68% net income-to-revenue ratio, twice as high as the 35% median for comparable companies.
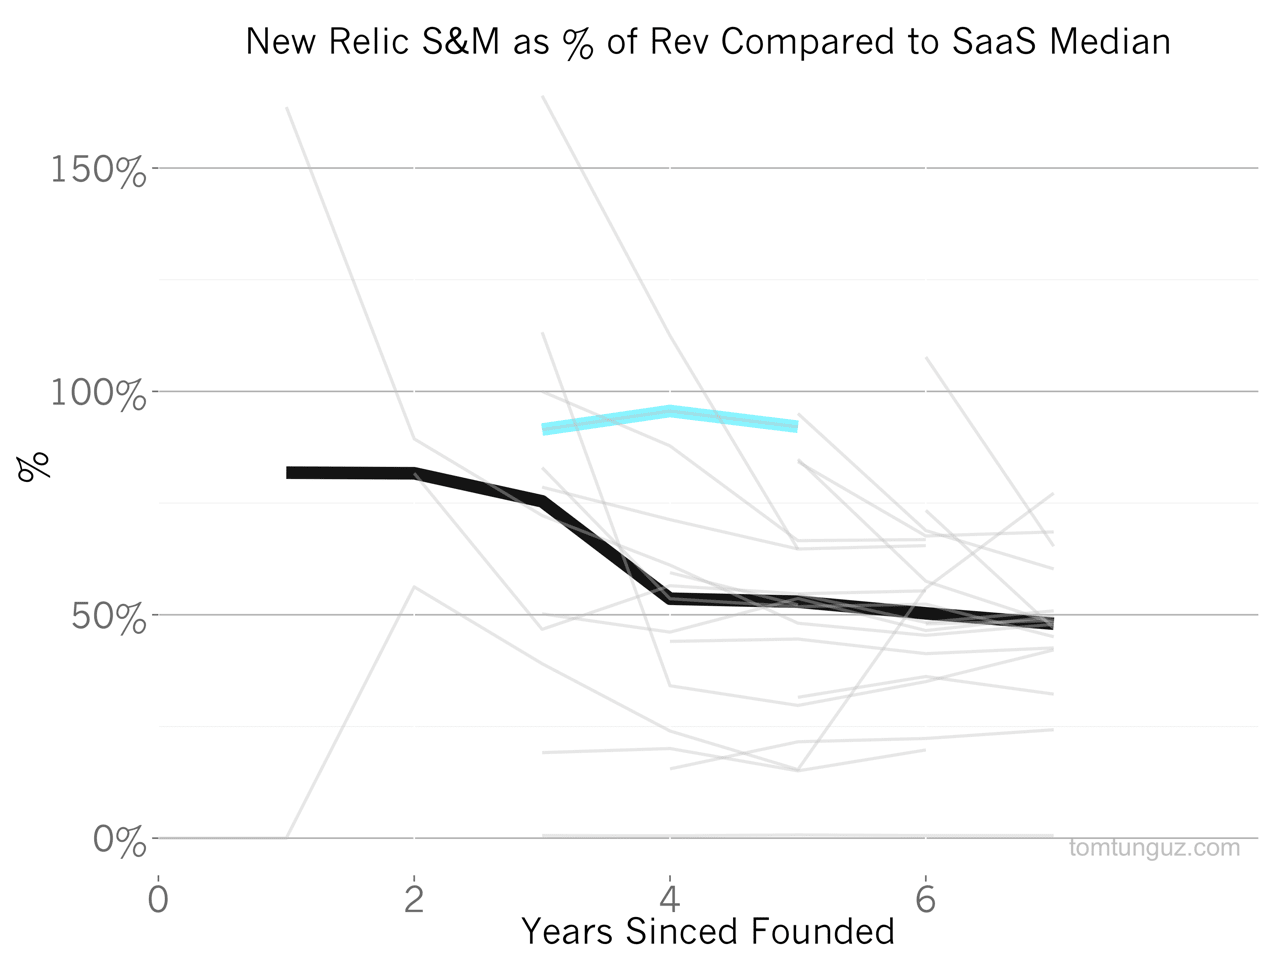
This substantially higher relative burn rate is driven by massive investment in sales and marketing. In years 4 and 5 of the company’s life, New Relic has invested twice as much on a percentage basis in sales and marketing (92% of revenue) than the median company (48% of revenue).
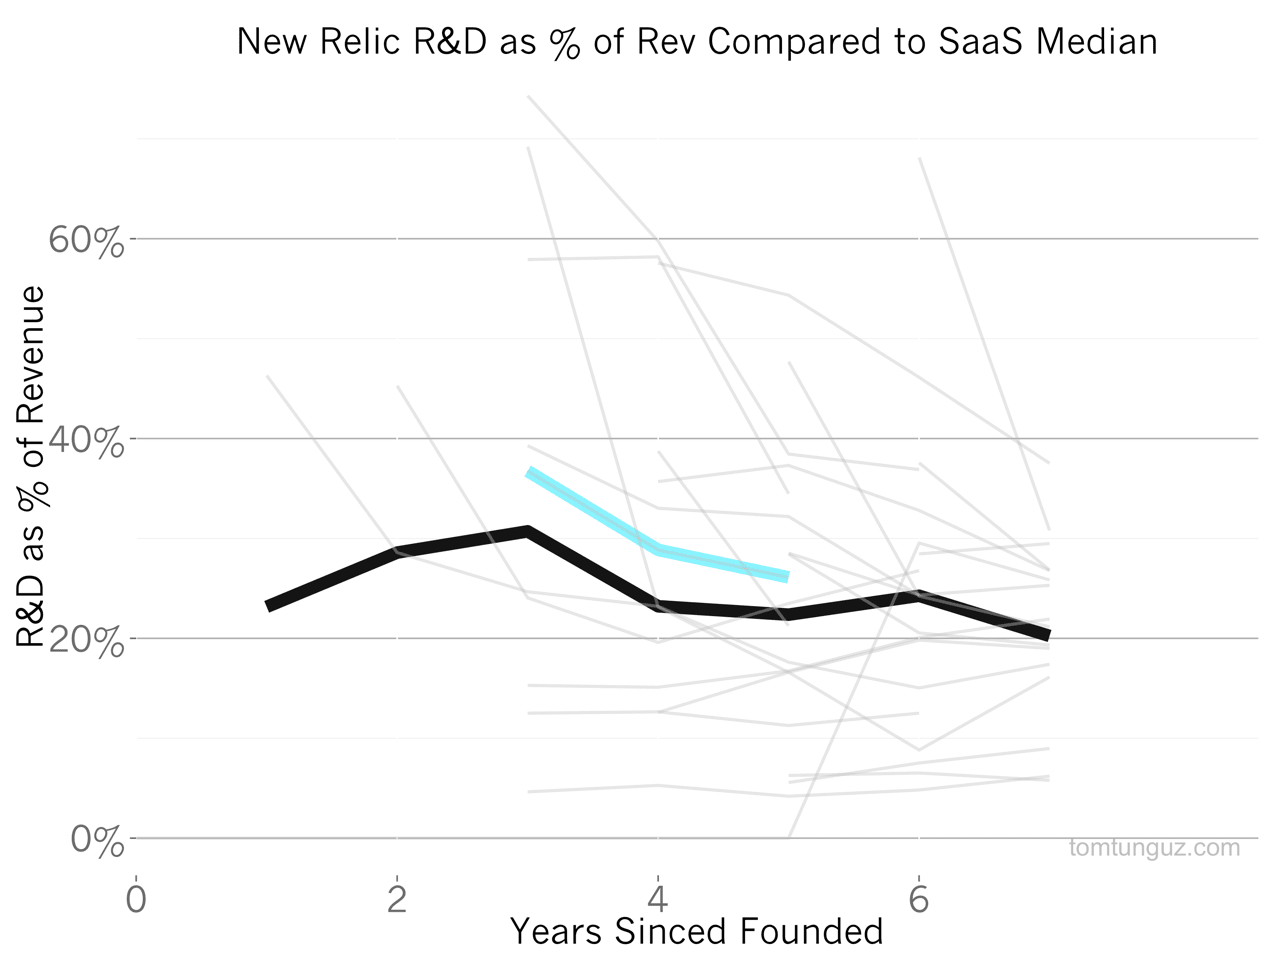
Meanwhile, New Relic is on par with its peer-set for engineering investment, at about 26% of revenue. This implies New Relic has been hiring sales people at an incredible clip. The business added 224 people in the past 12 months, and presumably the majority of those have joined the go-to-market teams.
New Relic has built an amazing company, one with some stunning negative revenue churn characteristics which should set the high-water mark for public SaaS companies.