The startup acquisition market is poised to have its best year in nearly a decade. If acquirers maintain the same pace from the first nine months of the year through Q4, more than 450 venture-backed startups will have been acquired, generating more than $25B in proceeds.
Given this state of affairs, it’s a good time to take stock of the major trends in the startup market. I’ve observed four:
- The total number of startup acquisitions has remained relatively constant over the past 14 years.
- But, the amount of large, disclosed startup acquisitions has decreased by about 25% in the past 14 years. Smaller acquisitions and acquihires have taken up the slack.
- The average size of disclosed startup acquisitions has increased 10% annually on an inflation adjusted basis.
- The startup M&A market correlates well with the Nasdaq, with an R^2 of 0.54
Let’s dig a bit deeper into each one of them.
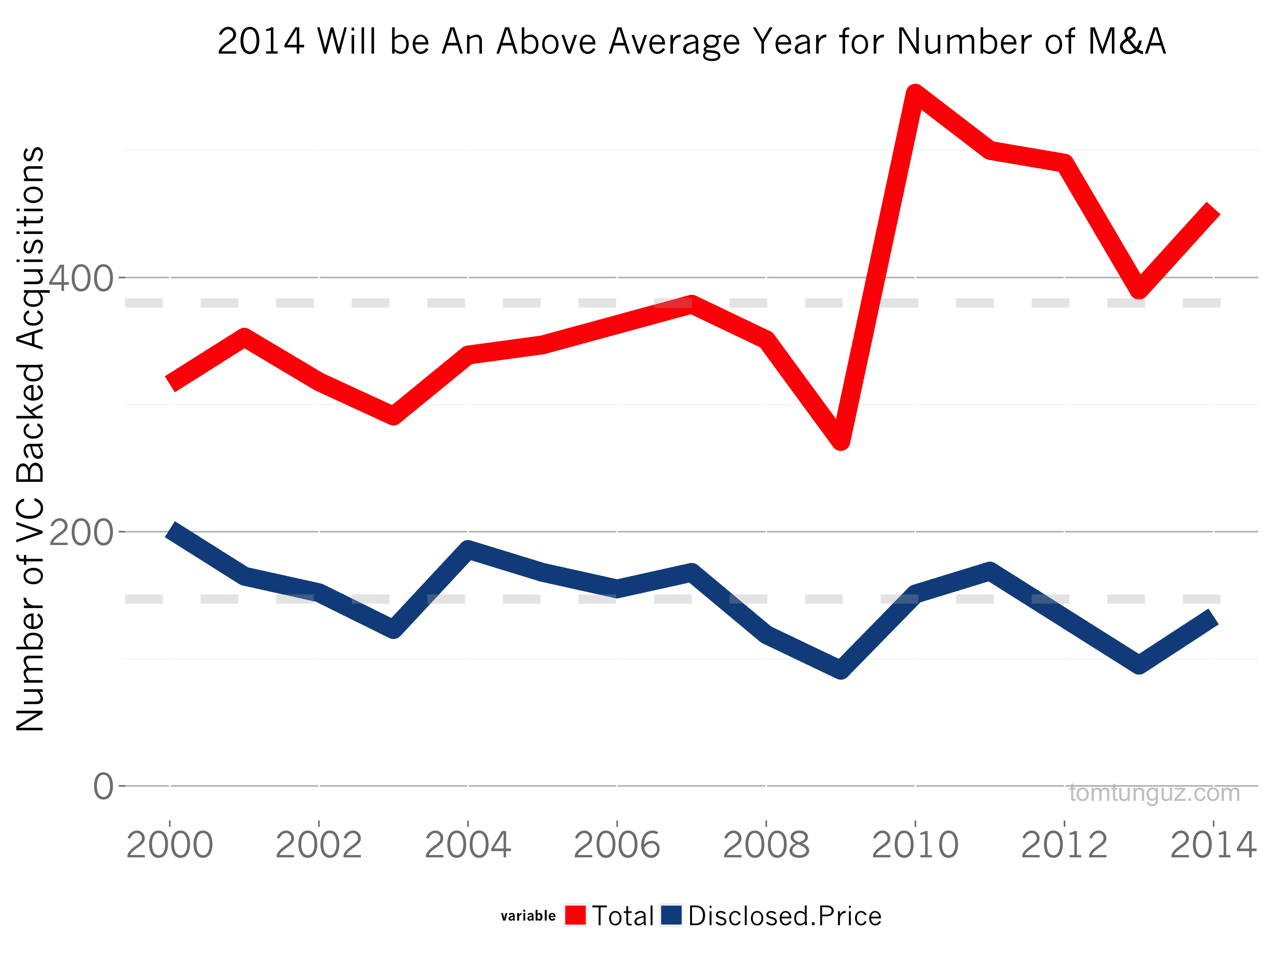
As the chart above shows, the total number of venture-backed acquisitions, in red, has exceeded the 14 year average (gray dashed line), every year since 2010. The past four years have been great liquidity years for startups.
The blue line shows the number of disclosed value acquisition. In 2014, acquirers will reveal the price of their acquisition 30% of the time. These disclosed acquisitions are most often the very largest ones because accounting rules require disclosure of material acquisitions for publicly traded companies.
The number of these presumably large, disclosed transactions has decreased over time, and has been below the 14 year average for the past three years.

Said more concretely, smaller, non-disclosed acquisitions have doubled in popularity over the past 14 years. The bar chart above shows the fraction of startup acquisitions with undisclosed prices.
This could be because tech companies have achieved such a huge scale that the material acquisitions ten years ago, are no longer material today. Or it could be that major tech acquisitions cost much more today than they did a decade ago. The truth is probably a combination of the two.
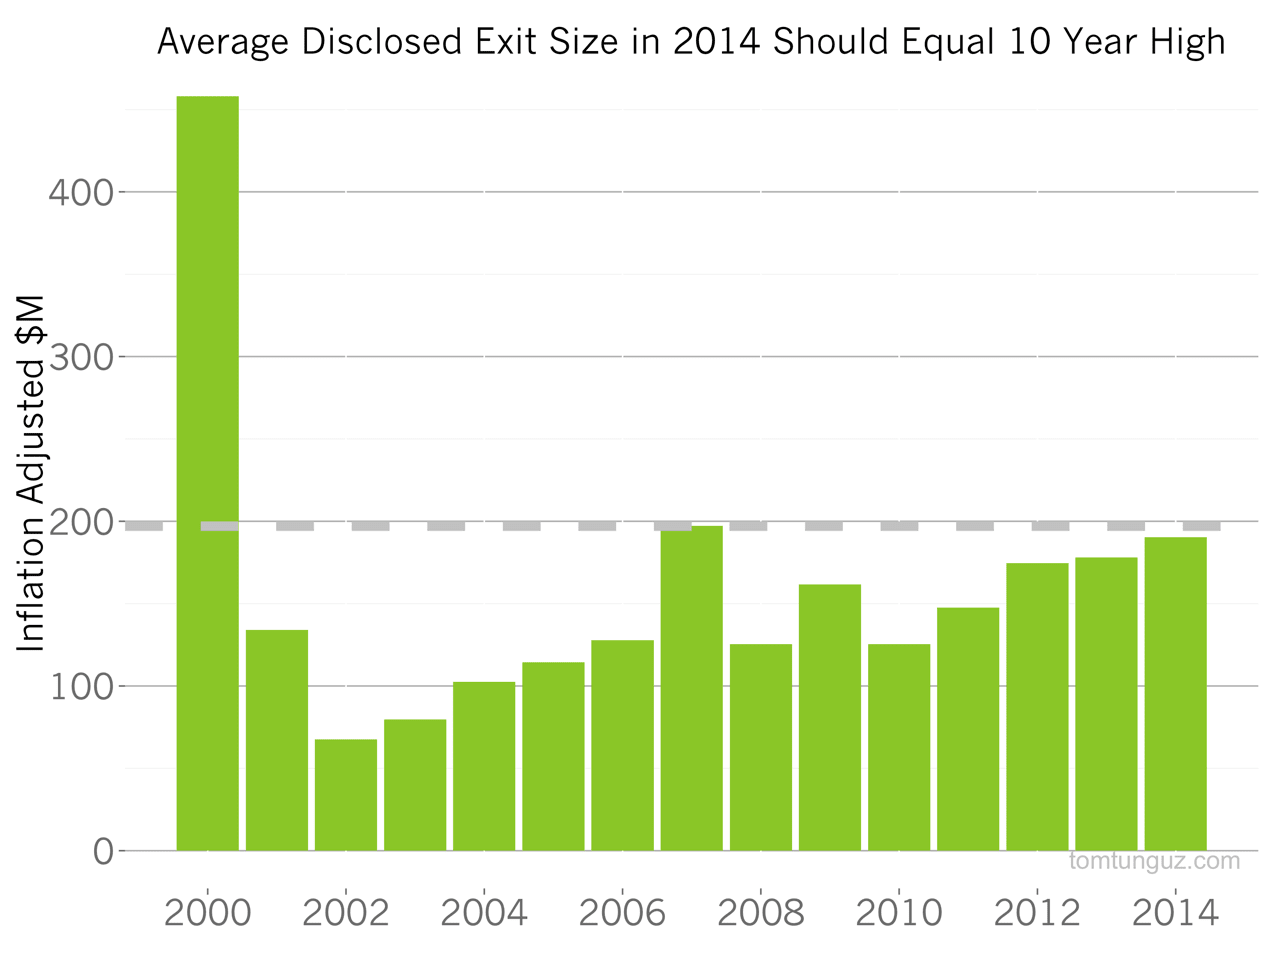
The average disclosed sale price in the same period has increased about 10% annually, inflation adjusted[2], each year since 2002, substantiating the hypothesis that big acquisitions are fewer in number, but command higher price points.
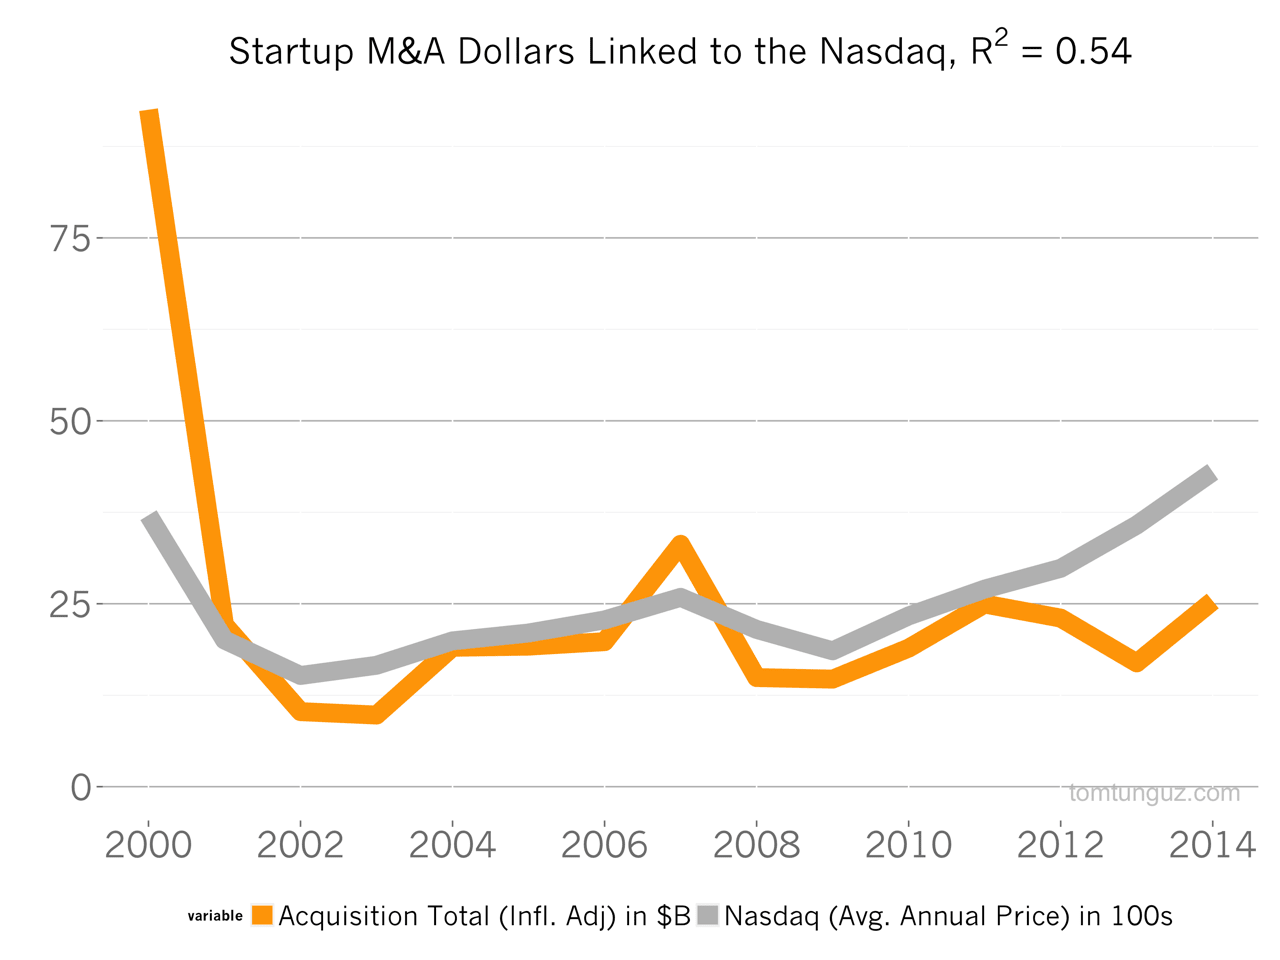
The chart above shows the aggregate value of venture-backed startup M&A activity from 2000 through 2014[1] in orange, using NVCA data. In 2000, M&A activity generated an astounding $92B in proceeds. 2014 will reach about $25B, placing third behind the amounts set in 2000, $92B, and 2007, $33B.
I’ve overlaid the price of the Nasdaq Composite in gray. Not surprisingly, the Nasdaq and venture-backed M&A shows strong correlation, an R^2 value of 0.54. When tech stocks are booming, cash is easy to raise in the public markets and share prices are high, decreasing the costs of acquisition compared to bull markets, when the cost of capital can be much higher.
The M&A market is vibrant both at the high end of acquisitions and at the acquihire segment. Even better, prices are increasing because valuations are tied to the public markets which has seen a terrific bull run over the past few years. There’s no question we’re in a terrific sellers market.
[1] 2014 is estimated based on the first three quarters, using straight-line extrapolation, i.e., I multiplied the number by 4/3.
[2] All the dollar figures are inflation adjusted.