When we published the results of the freemium survey earlier this year, we noticed respondents targeting the enterprise observed higher net dollar retention and lower churn than those startups targeting other segments. I wondered if we could observe any other patterns about enterprise businesses, so I produced this analysis of public companies with ACVs (annual contract values) of $100k or greater.
In the series of charts that follow, the red bars indicate the value of the metric during the year of IPO. And the blue dashed line is the median.
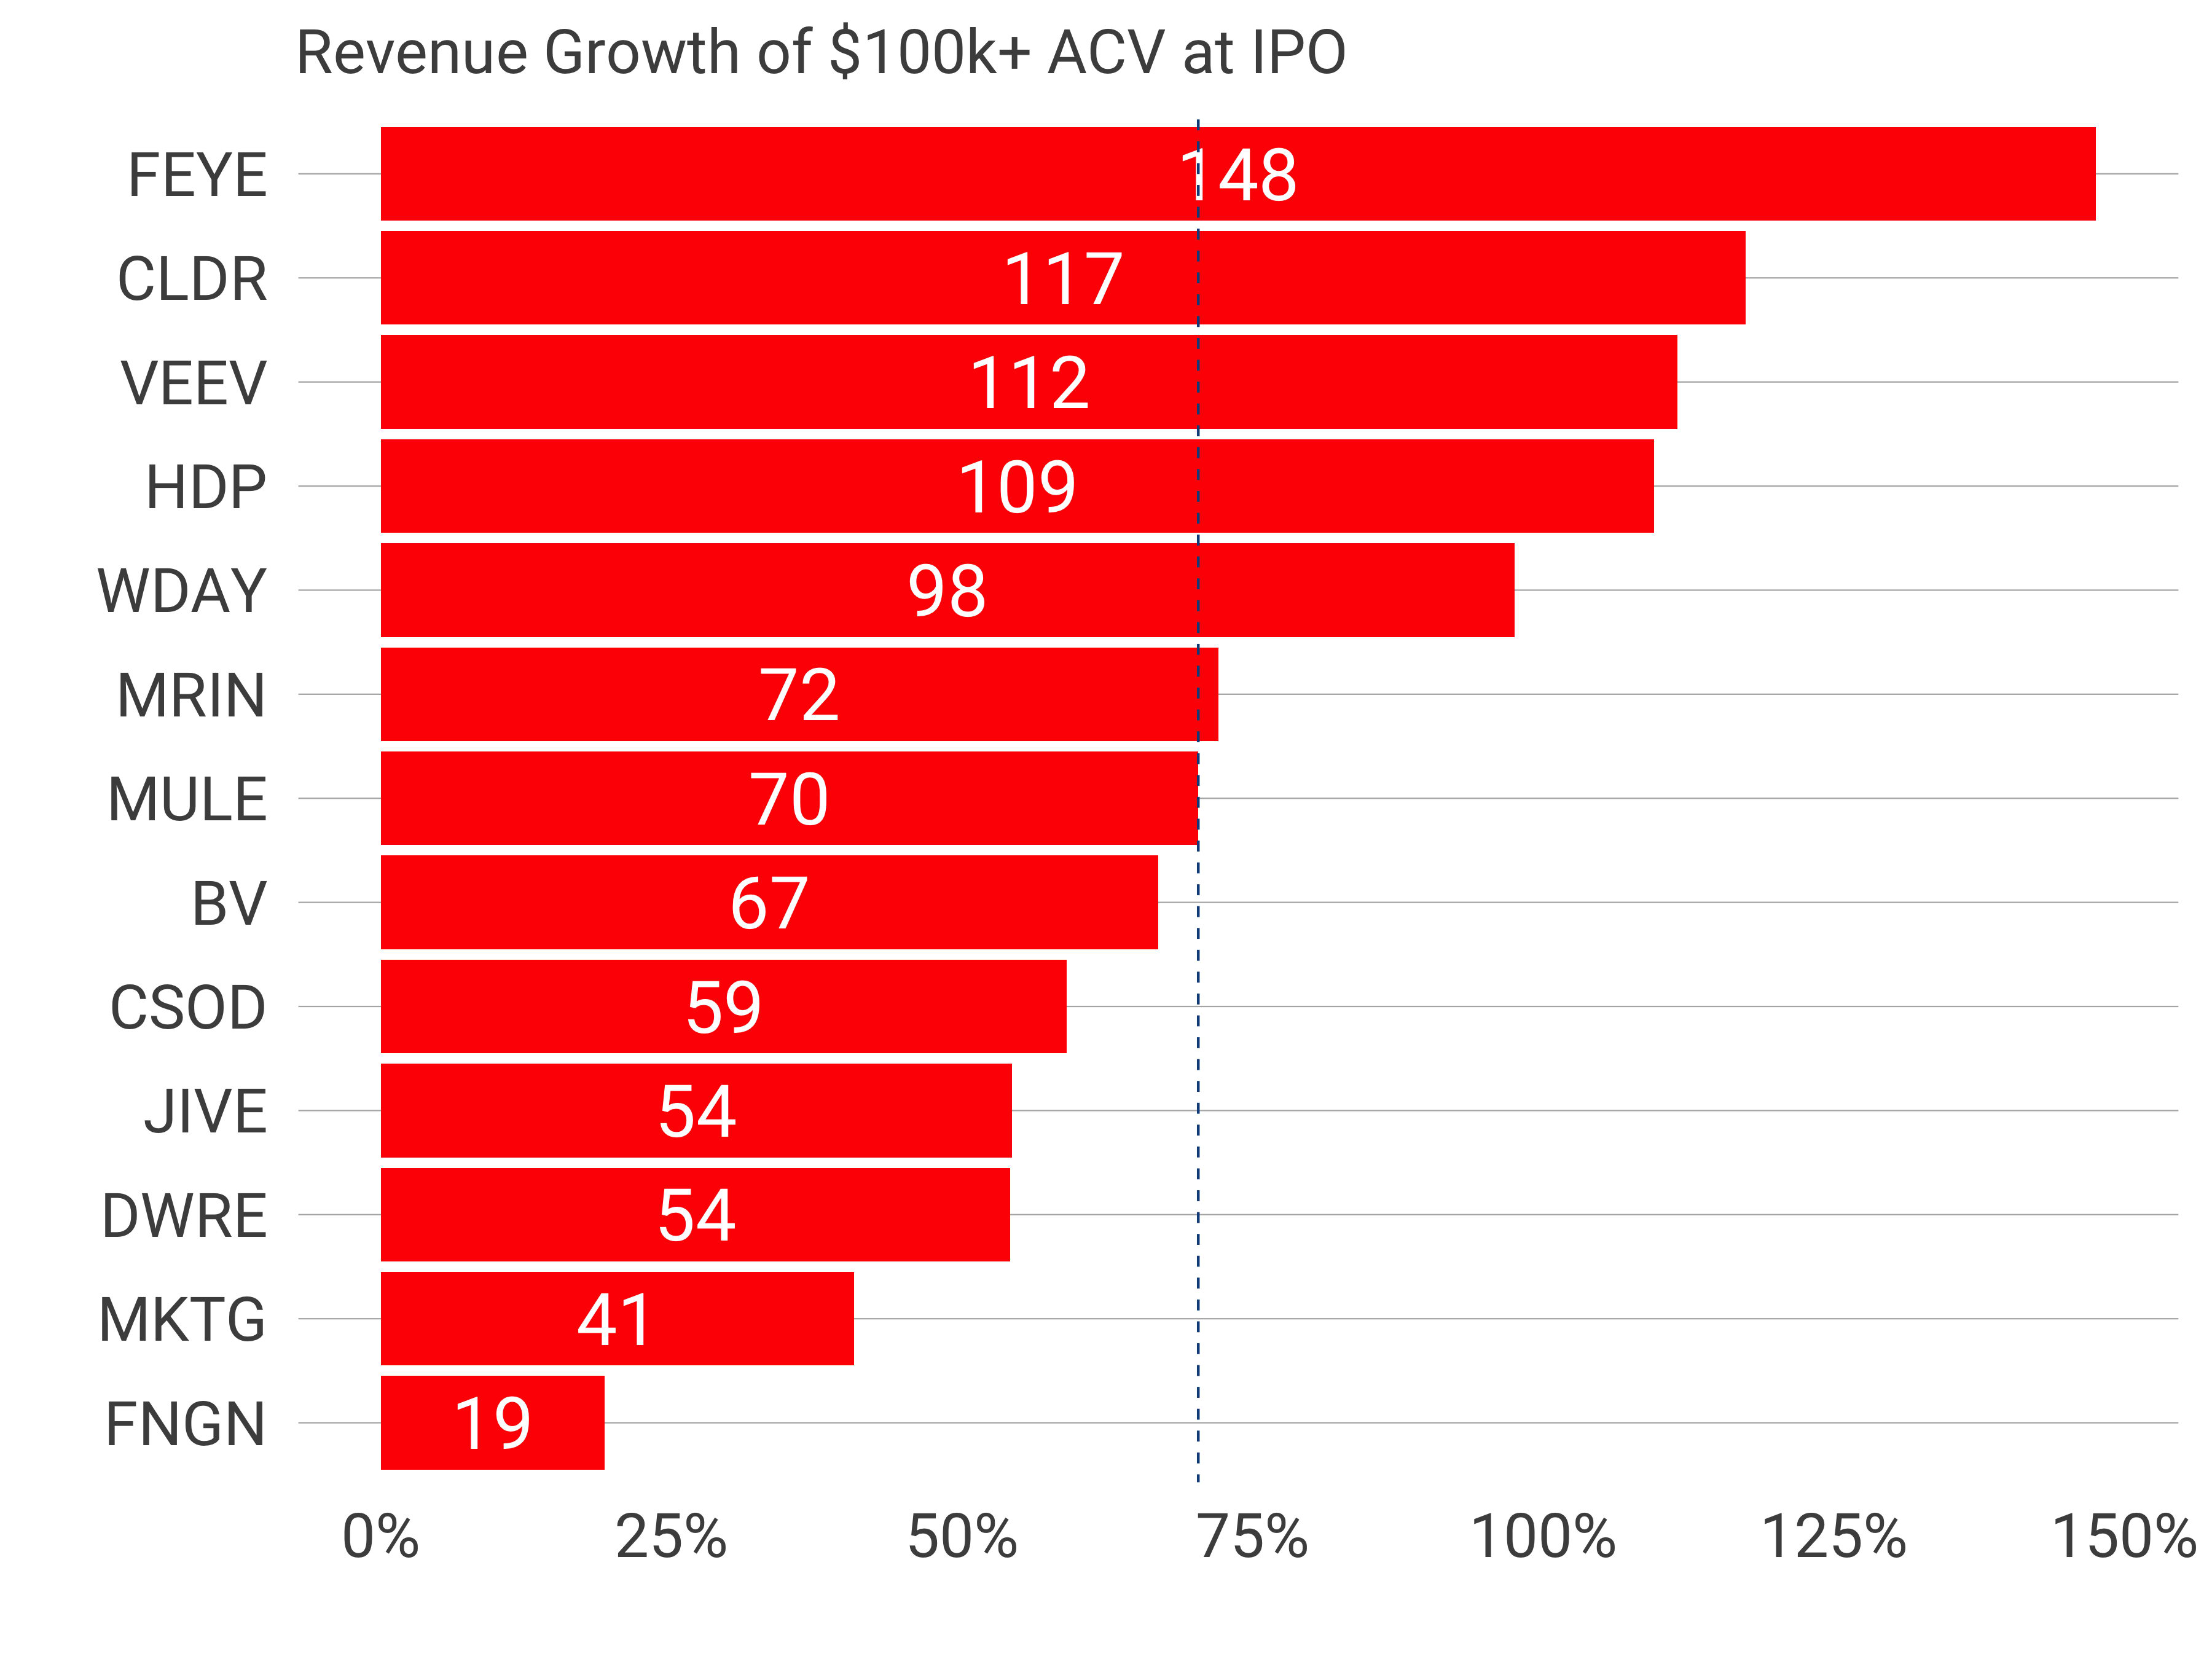
Revenue growth at IPO spans quite a wide range from FireEye’s 148% to Financial Engine’s 19%. The median is 70%, which is consistent across all other modern software companies at IPO.
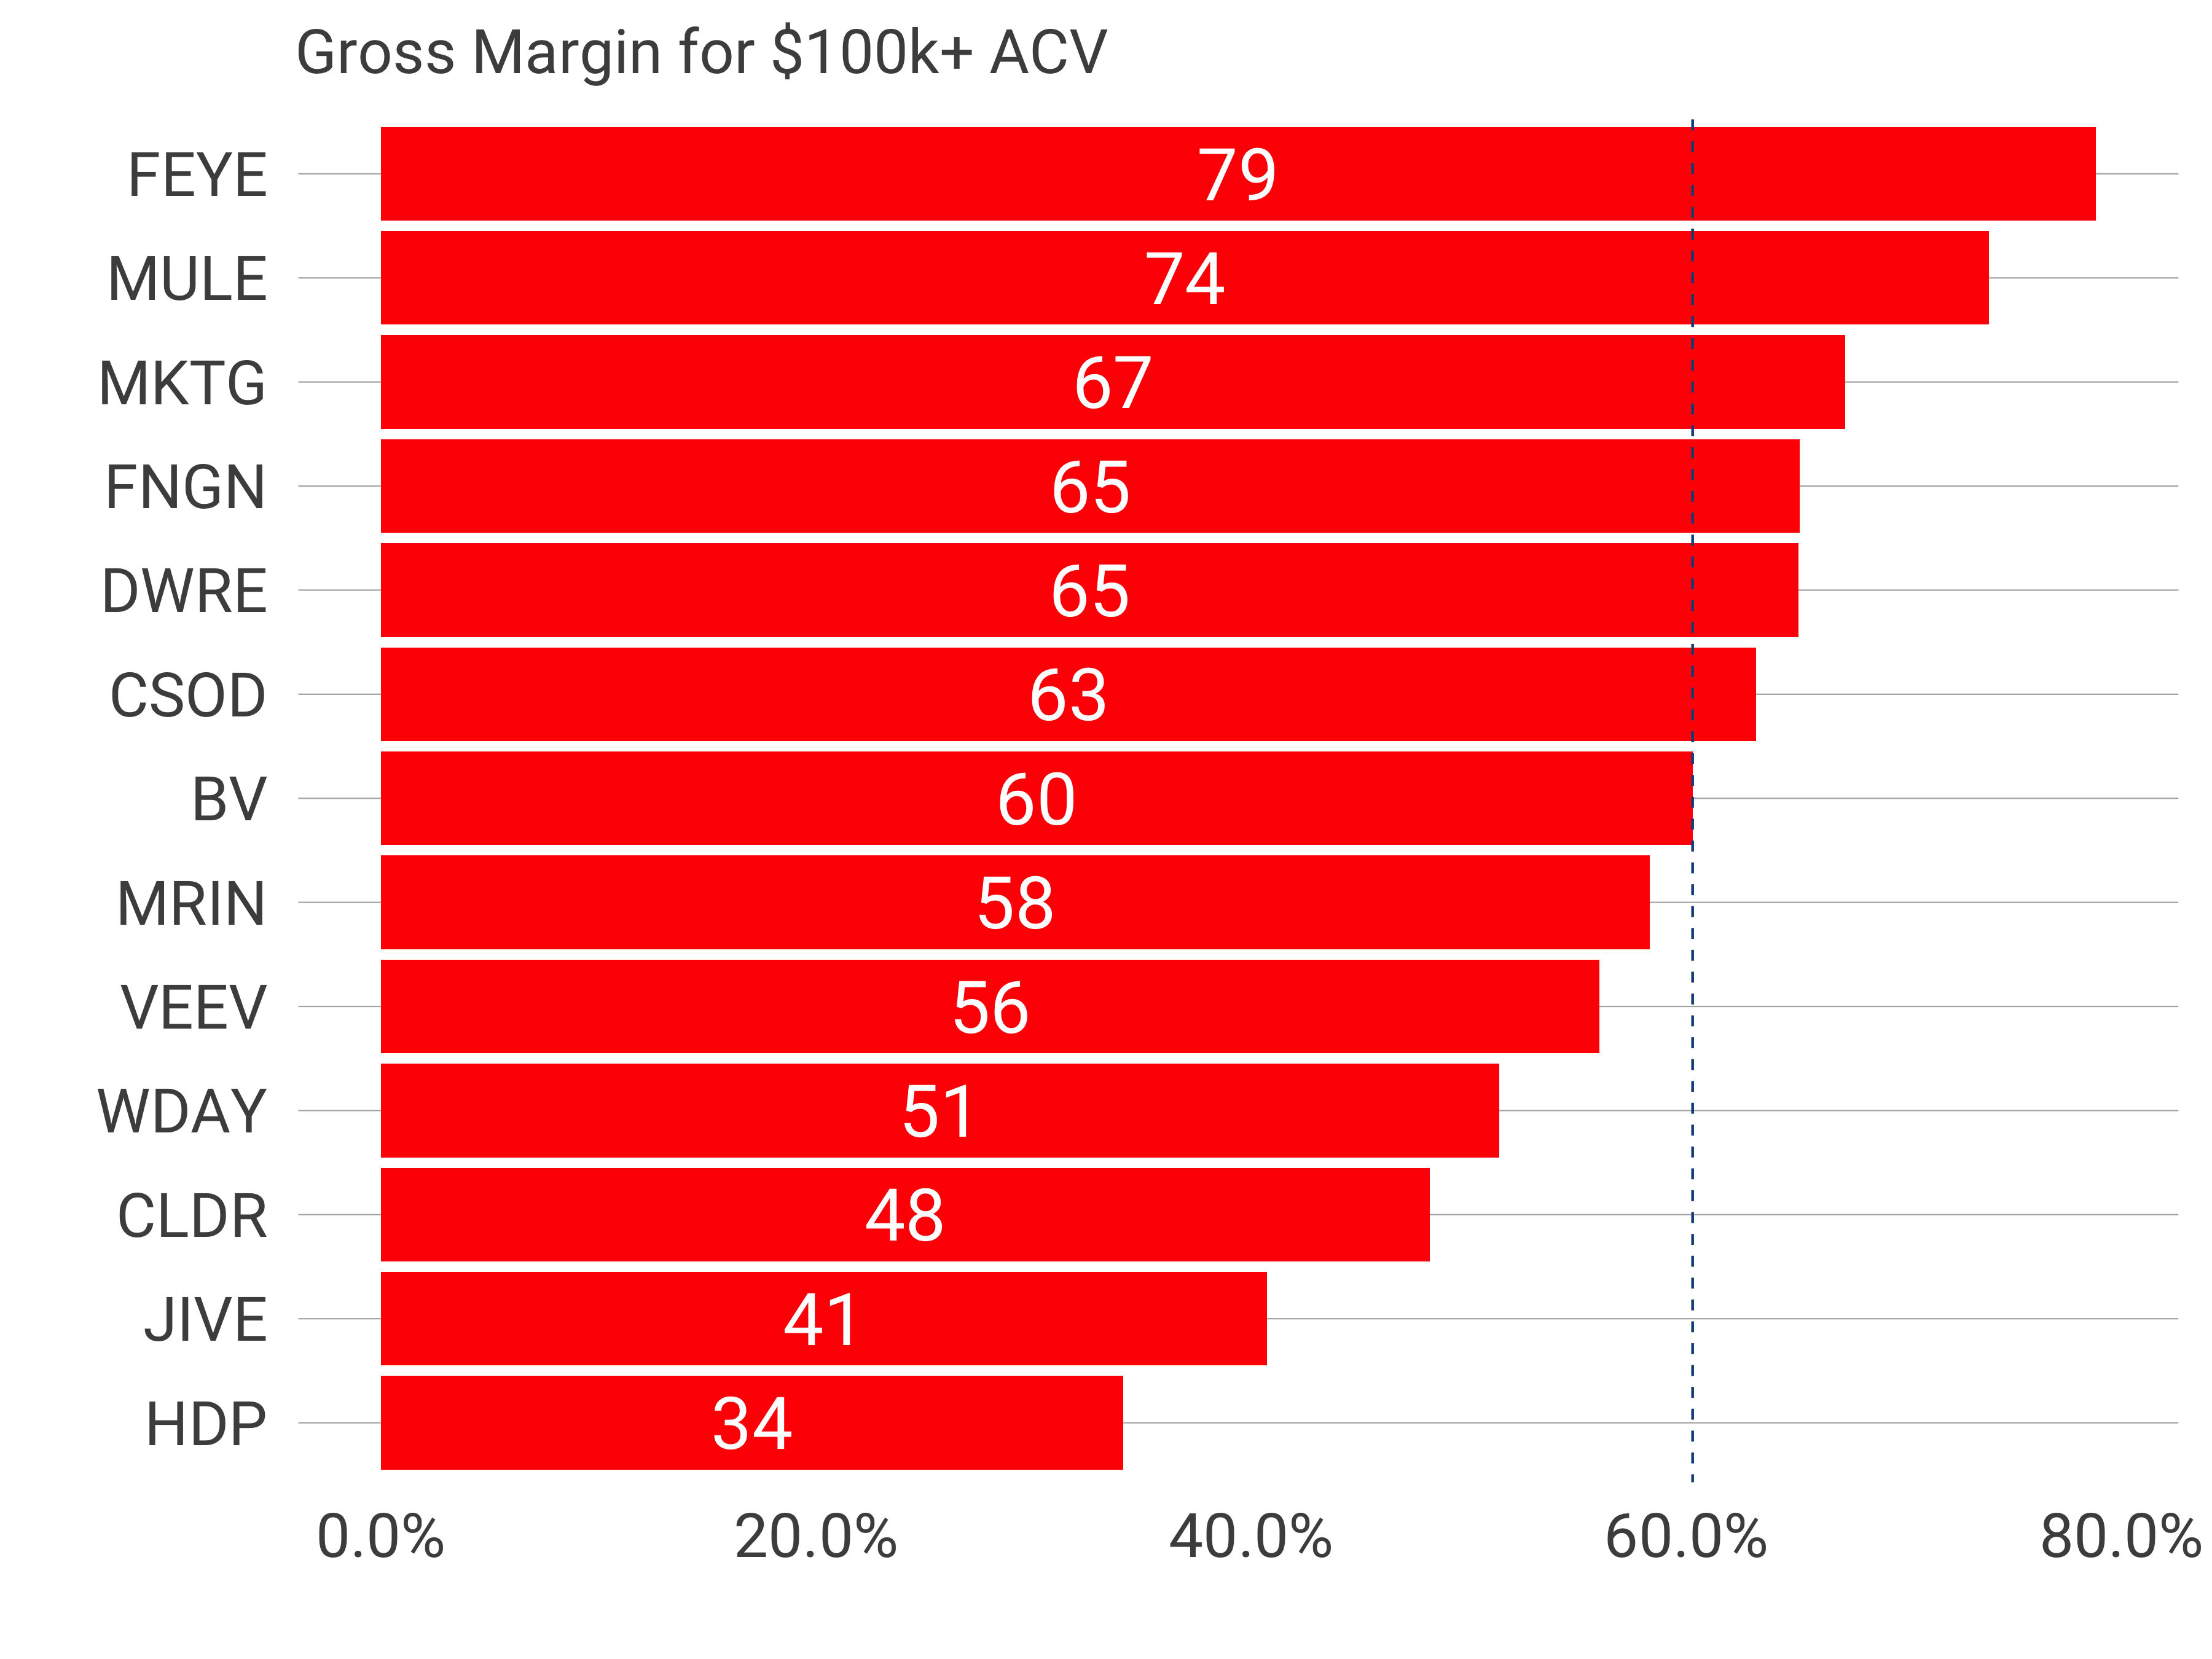 Gross margins are also span the gamut from 79% to 34%. These distributions indicate that there’s no clustering as a result of a higher price point. However, in this case, the $100K gross margins of 60% are about 10% lower than the entire population sitting at 66%. The p value is 0.1 suggesting the difference has a high likelihood of being a material difference.
There are a few potential hypotheses for this. Gross margins are lower when customer support costs are higher and when hosting costs are higher. If enterprise customers demand more support or if they demand more expensive infrastructure (like single tenant databases), they may impose lower gross margins on their vendors. Last, enterprise customers often demand more professional services which tend to run at much lower gross margins than software, which may also depress the margins.
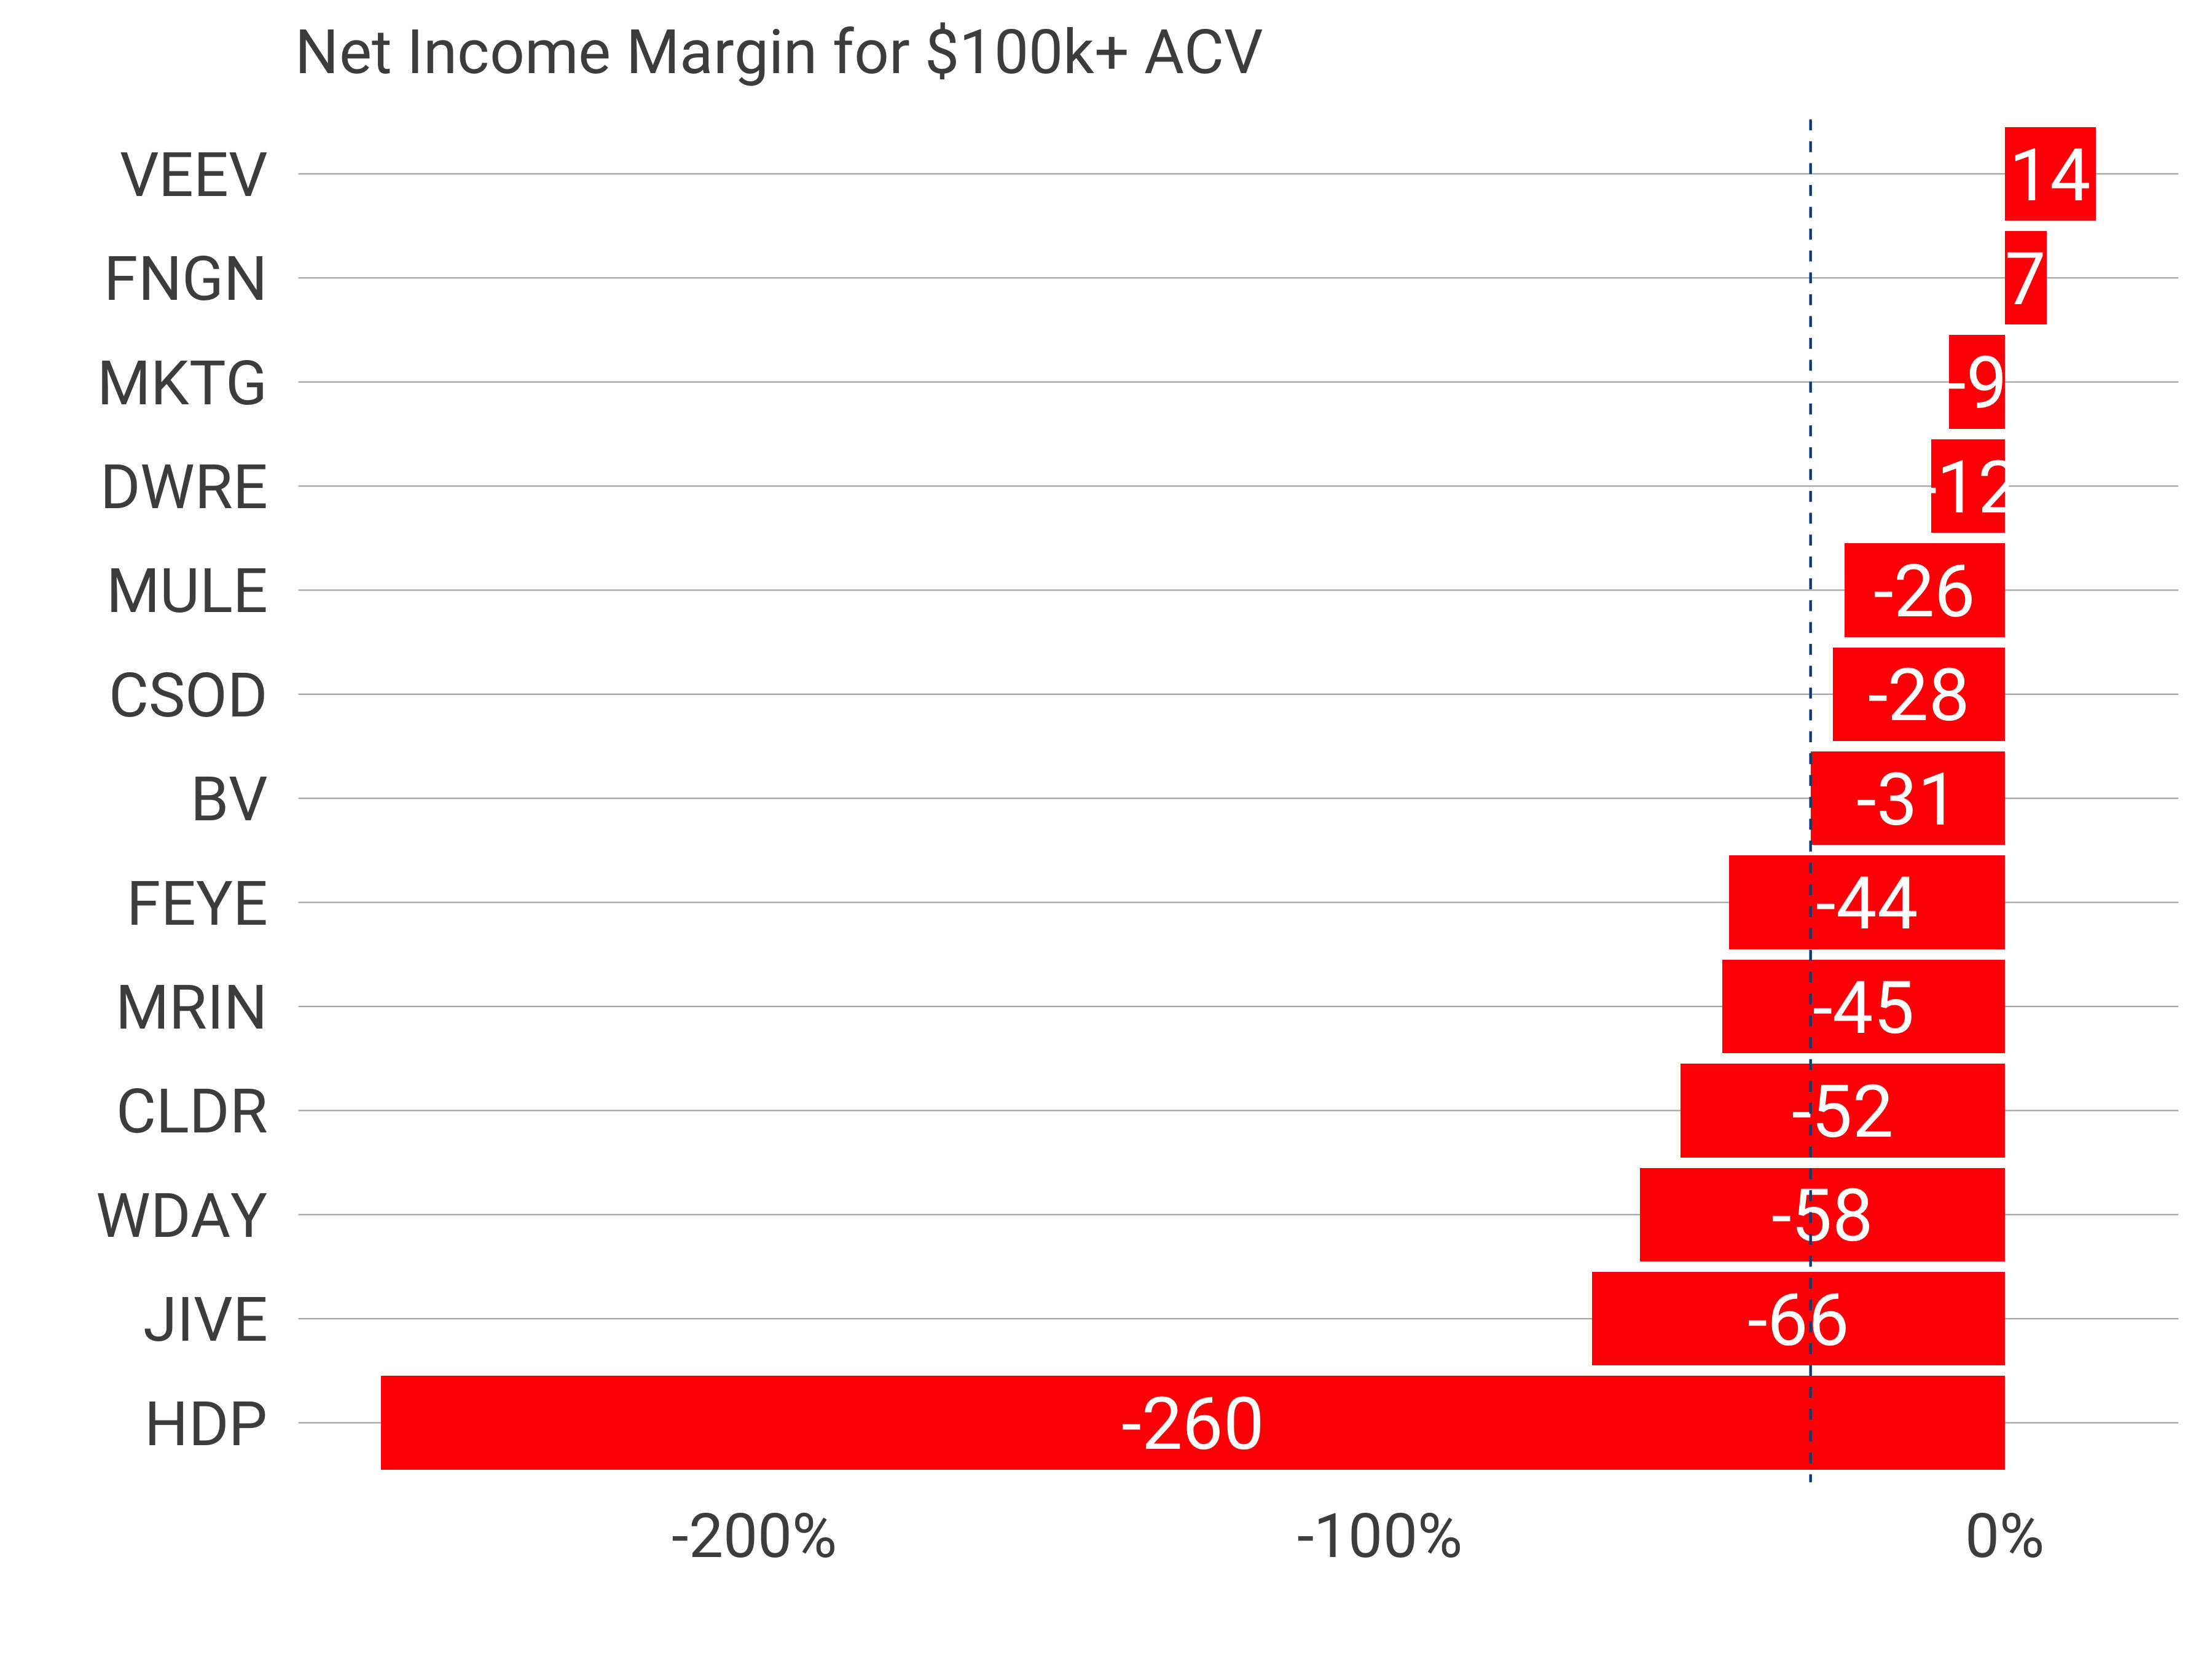
Examining net income margin (profitability), we find one outlier in Hortonworks. Again, a broad distribution exists. The median NIM at IPO is -31% identical to -29% across the board.
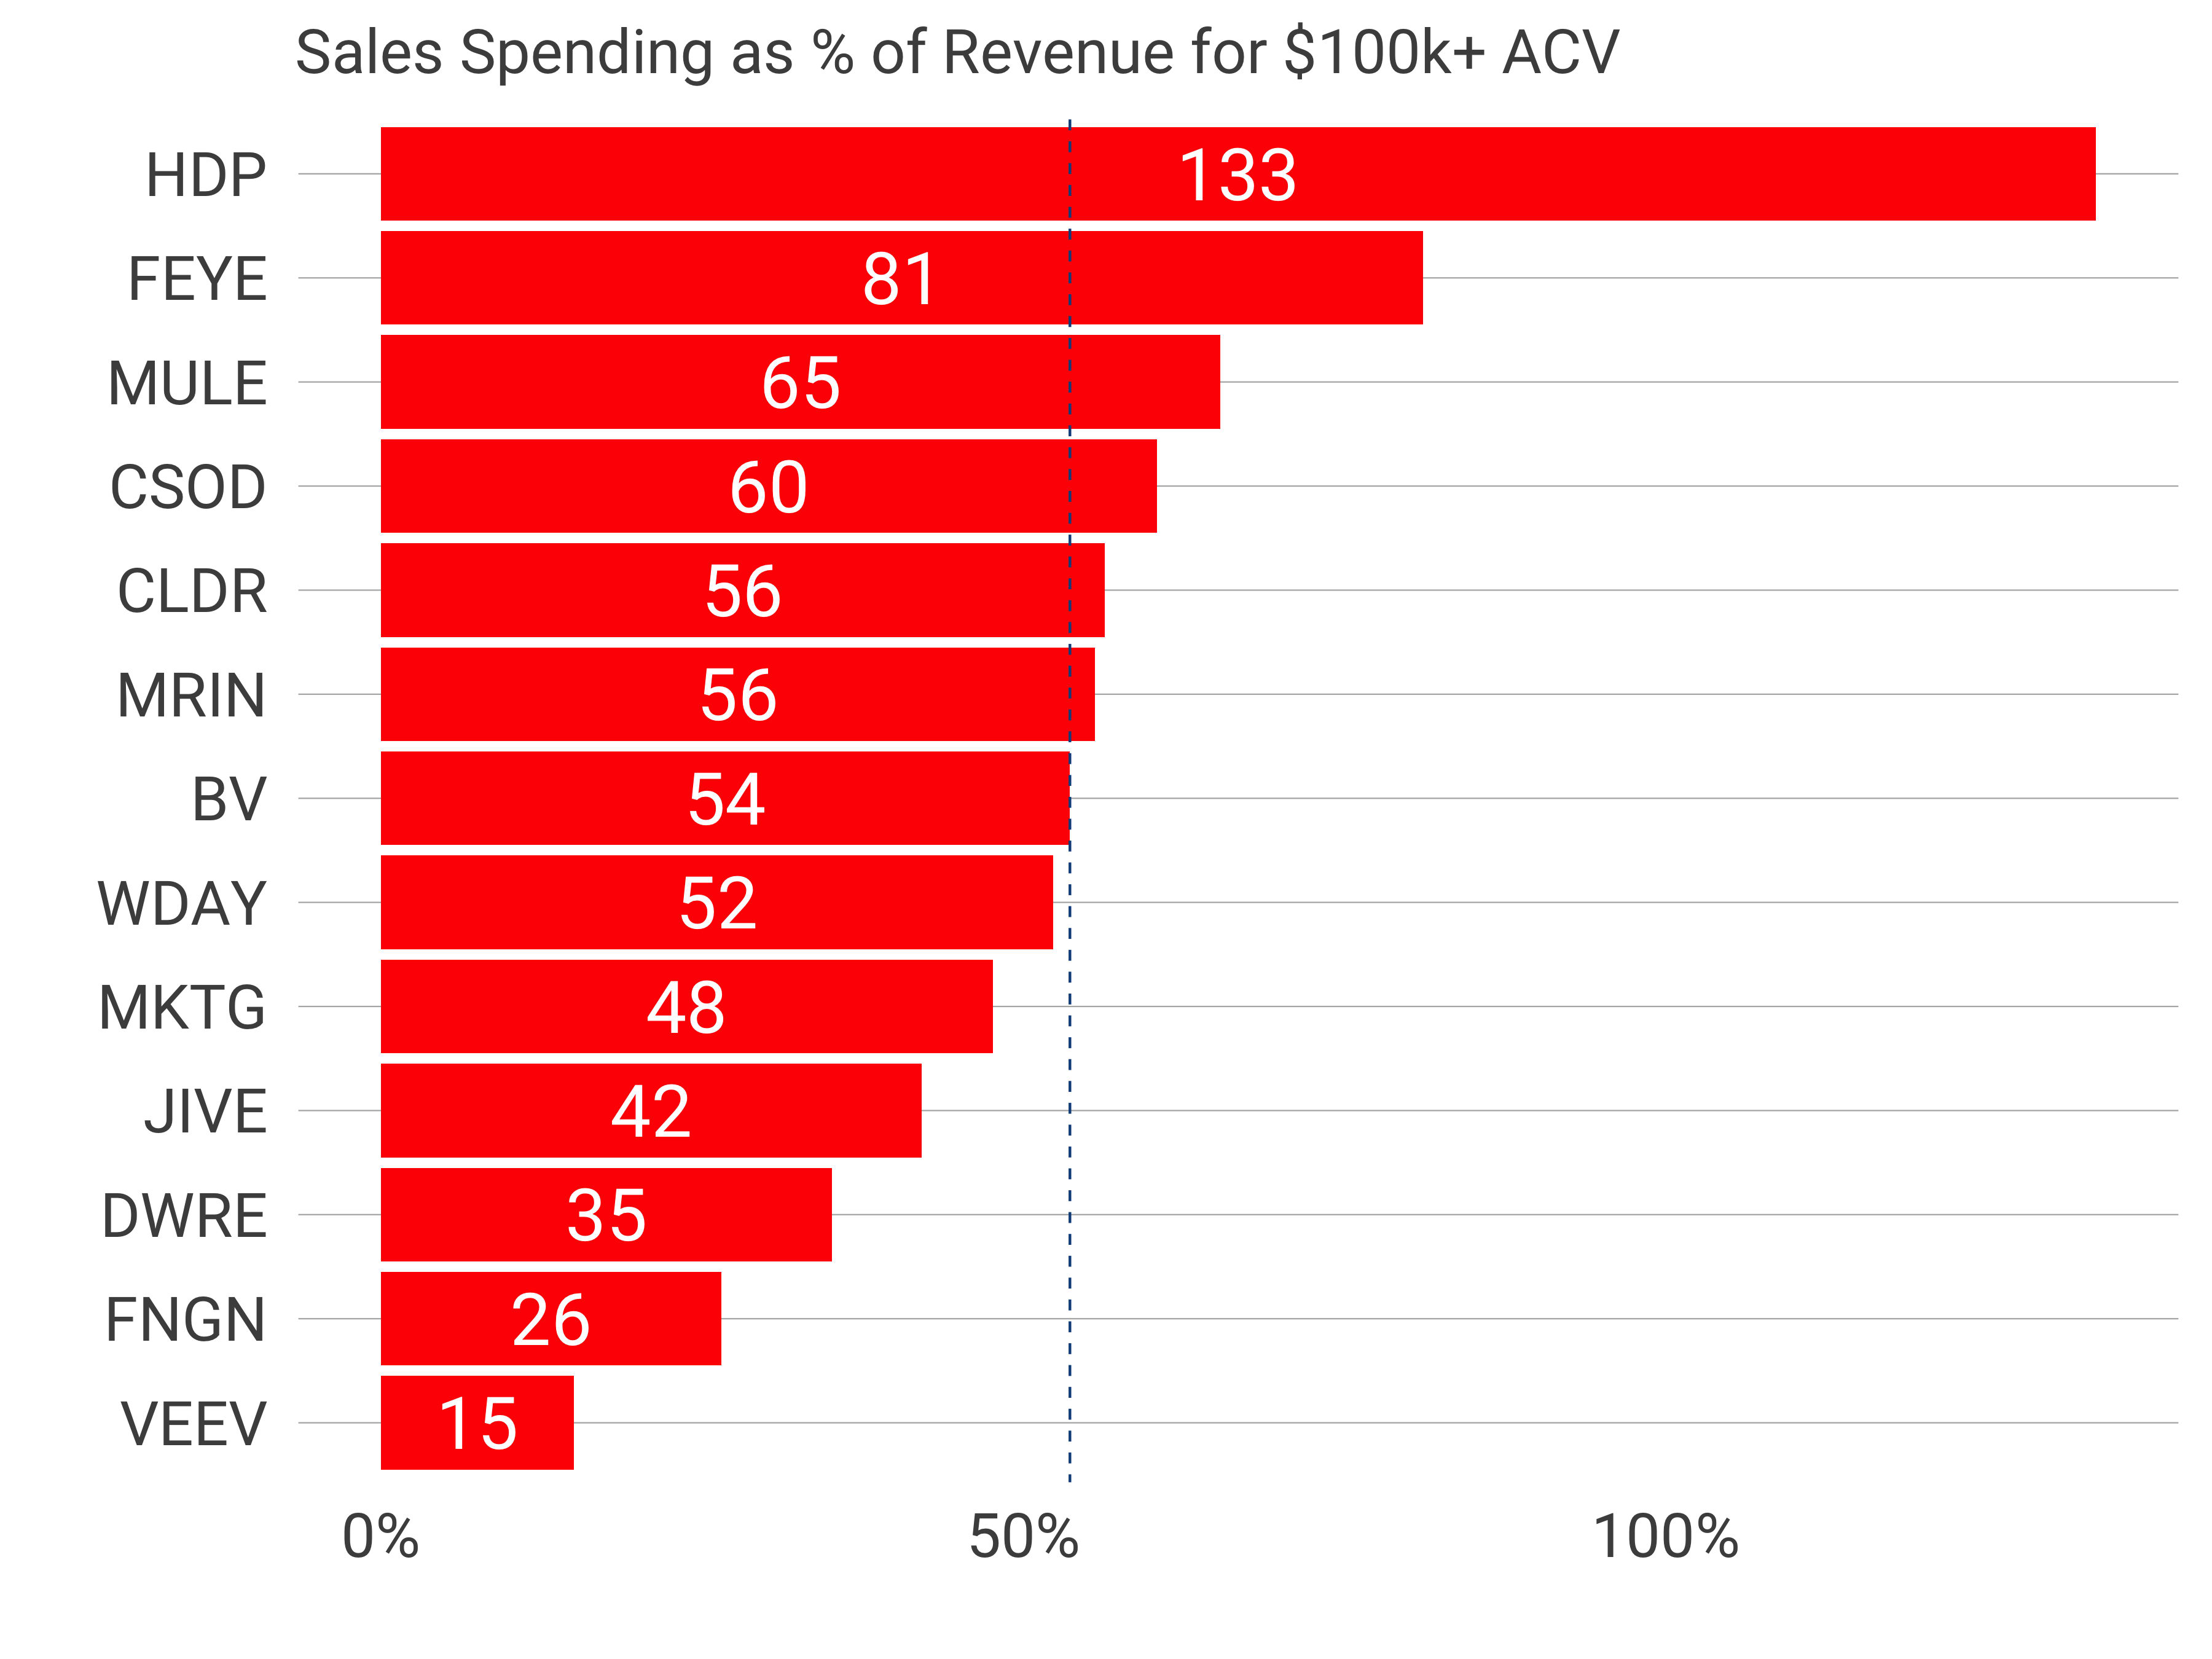
Next, let’s turn to Sales and Marketing as a Percentage of Revenue. The most efficient here is Veeva, spending only 15% of revenue on sales, just incredible. The median is 54%, which again doesn’t deviate from the population as a whole.
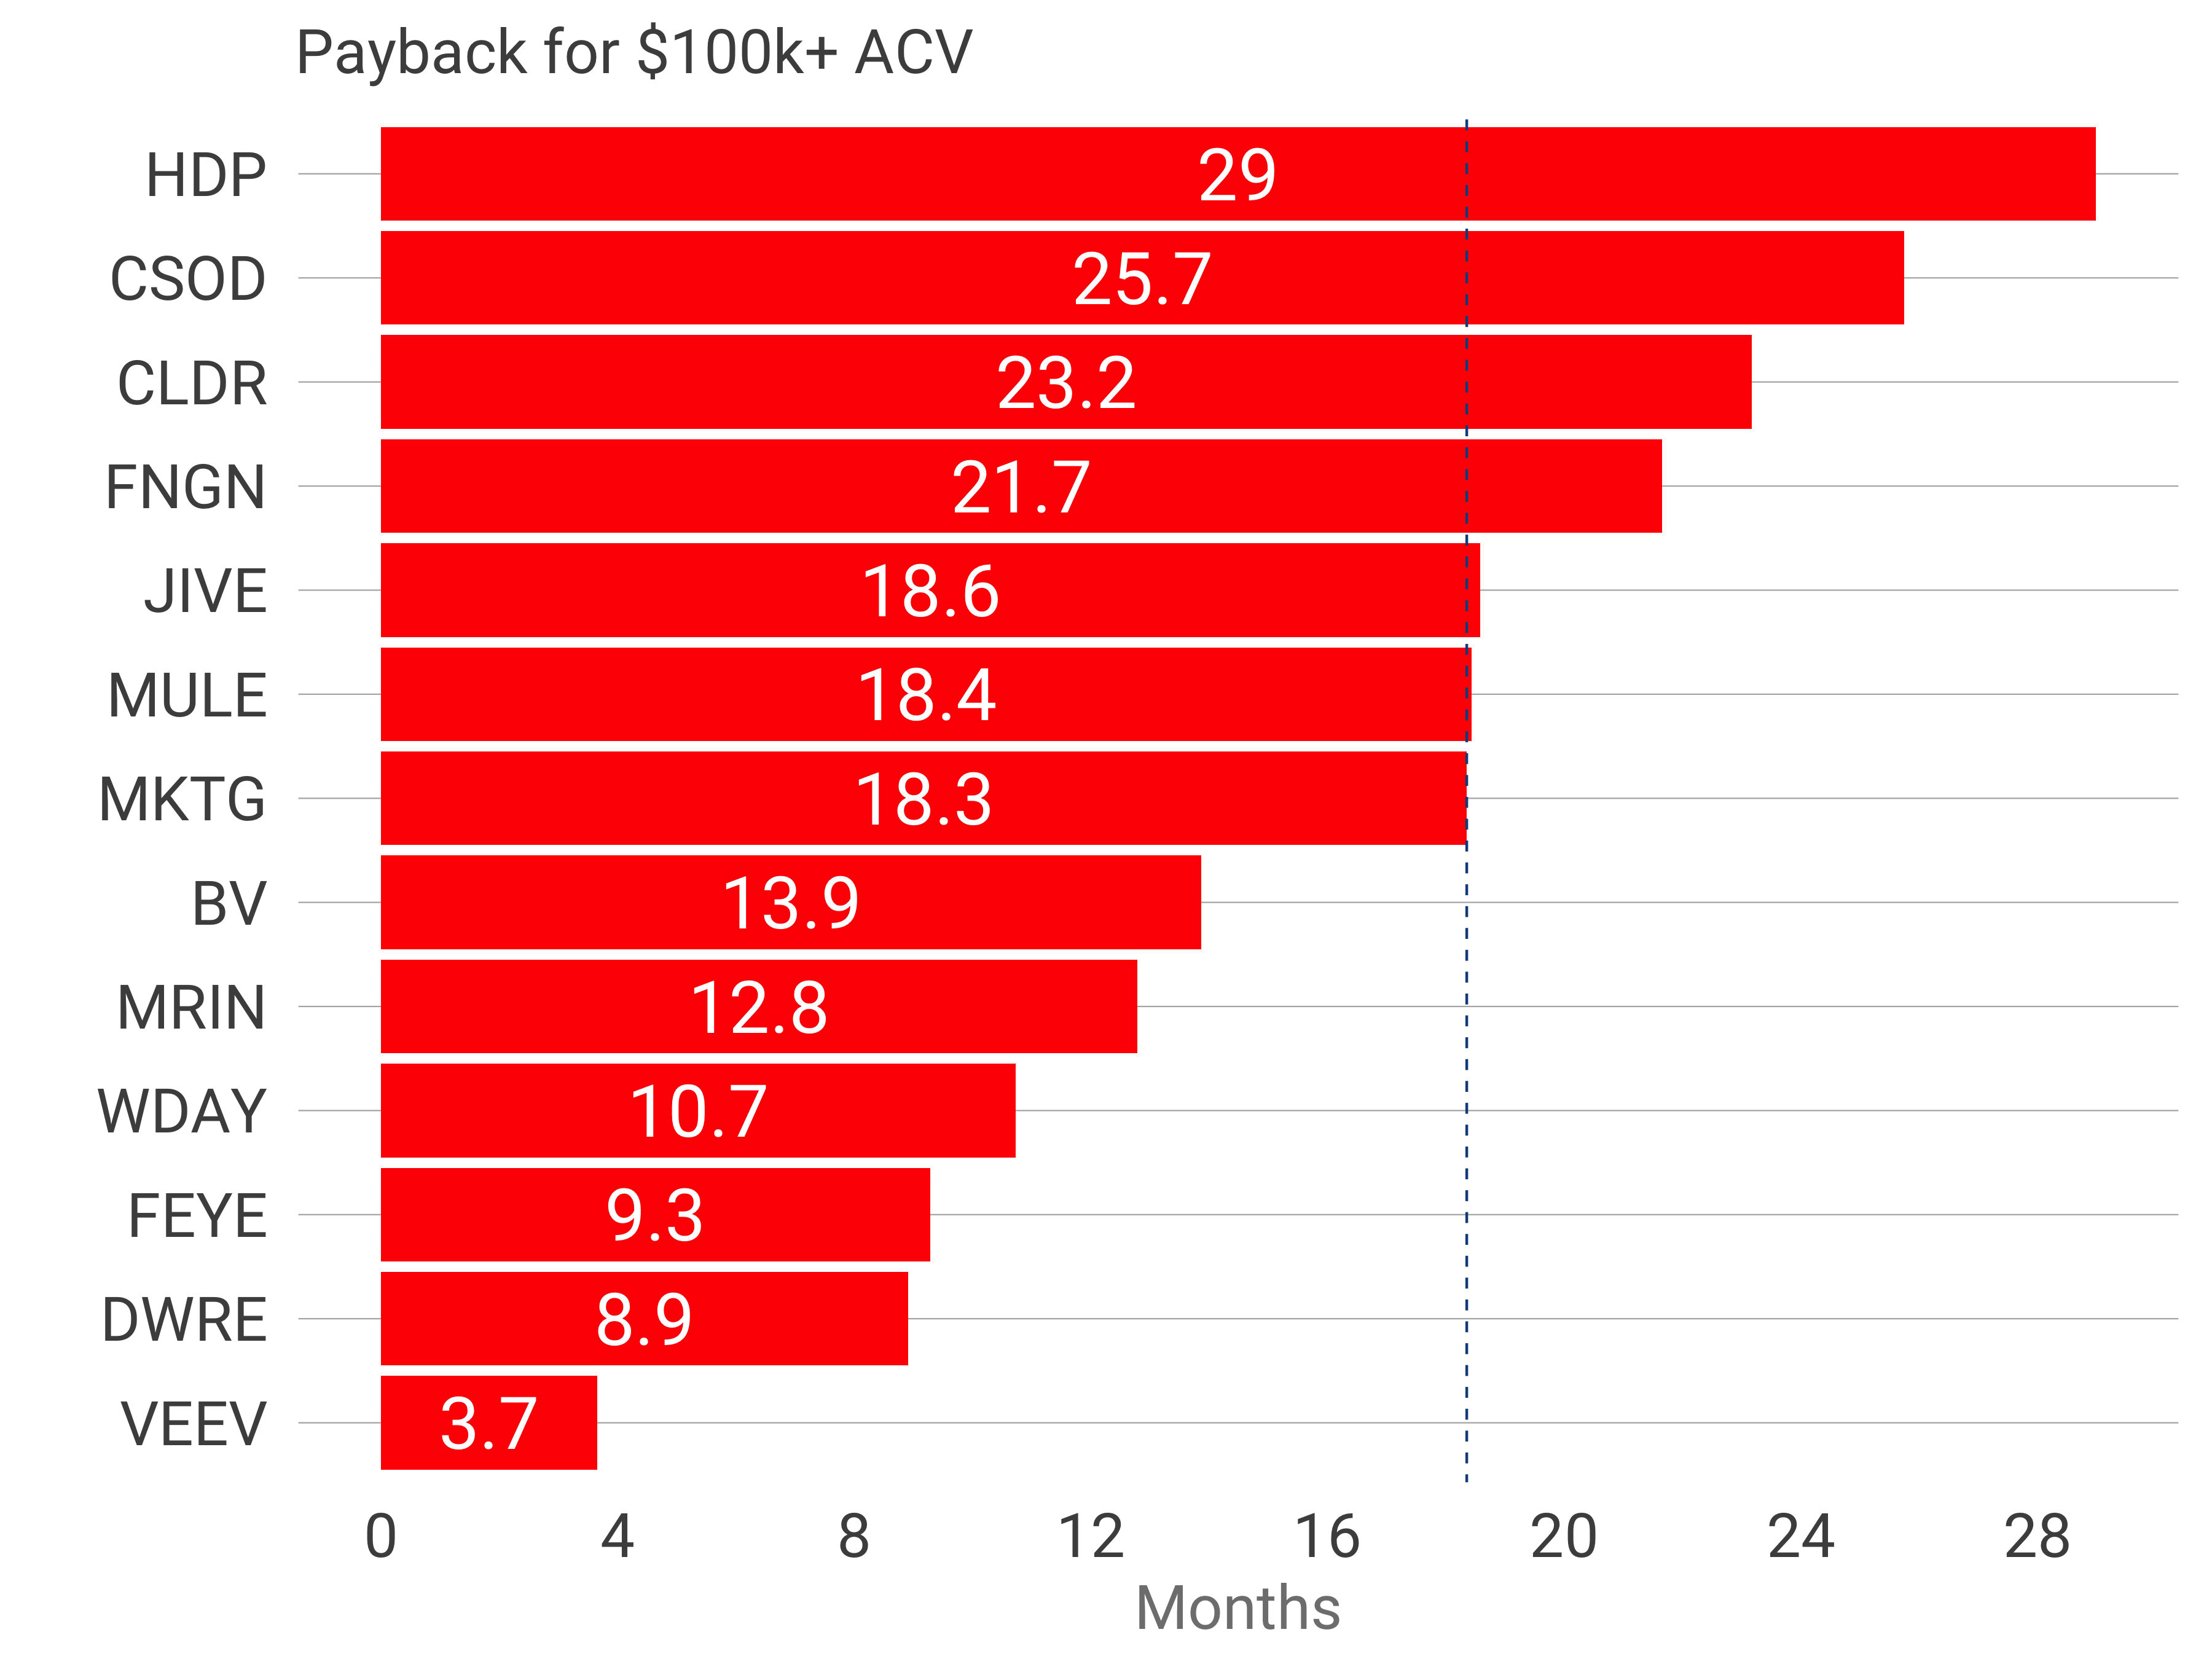
Last, let’s examine payback period. We know churn rates are meaningfully lower for enterprise companies. Does the other side of the customer equation also favor them?
The median estimated payback period is 18 months. Veeva clocked 3.7 months and Hortonworks 29 months. The median across all companies is 15.5 months compared to 18.4 months in the enterprise. But the t test suggests no meaningful difference, with a p value of 0.97, indicating the means are identical.
In conclusion, the only meaningful difference between enterprise companies and the rest of the public software population is a slightly lower gross margin - about a 10% decline - relative to others.