Cloudera is the second of the Hadoop players to go public. Last week, the company filed their S-1 and revealed a massive business. Cloudera generated $261M in revenue, counts 500 clients and grows those accounts by 43% annually. 18% of their customers run Cloudera software in the cloud, a surprisingly large number.
Hortonworks is Cloudera’s chief competitor. In the following charts, we’ll compare the two businesses. These analyses compare the two companies based on the year they went public, marked 0 in the charts. Negative years are years before IPO.
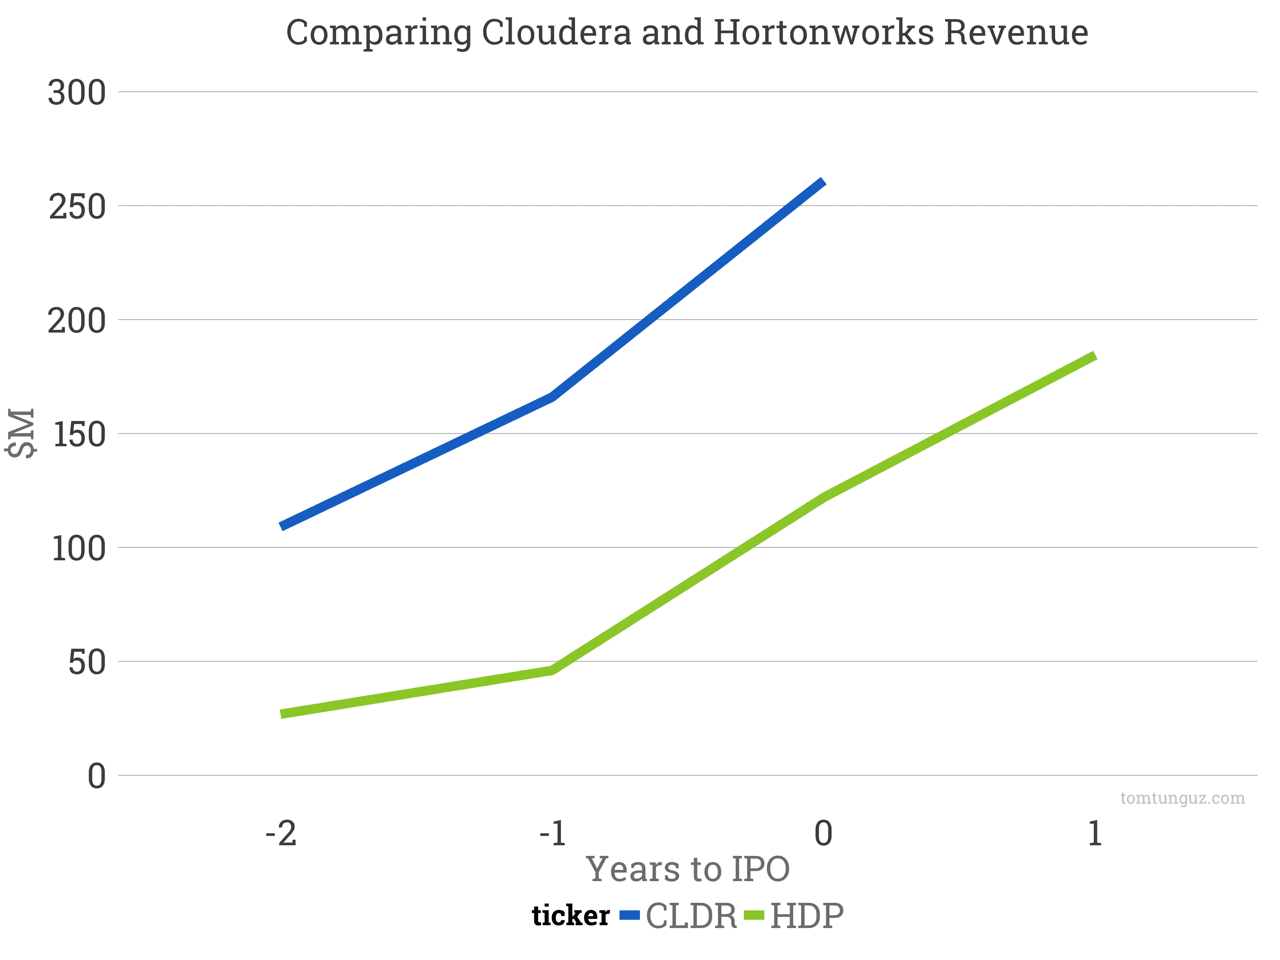
Hortonworks grew very quickly. $27M, $46M, $122M at IPO and then $184M the year after IPO. Cloudera grew from $109M to $166M to $261M, more than 2x the revenue scale of Hortonworks. Hortonworks tallied a tremendous growth rate of 165% at IPO. In the year after IPO, growth settled to 52% which is comparable to Cloudera’s 57%.
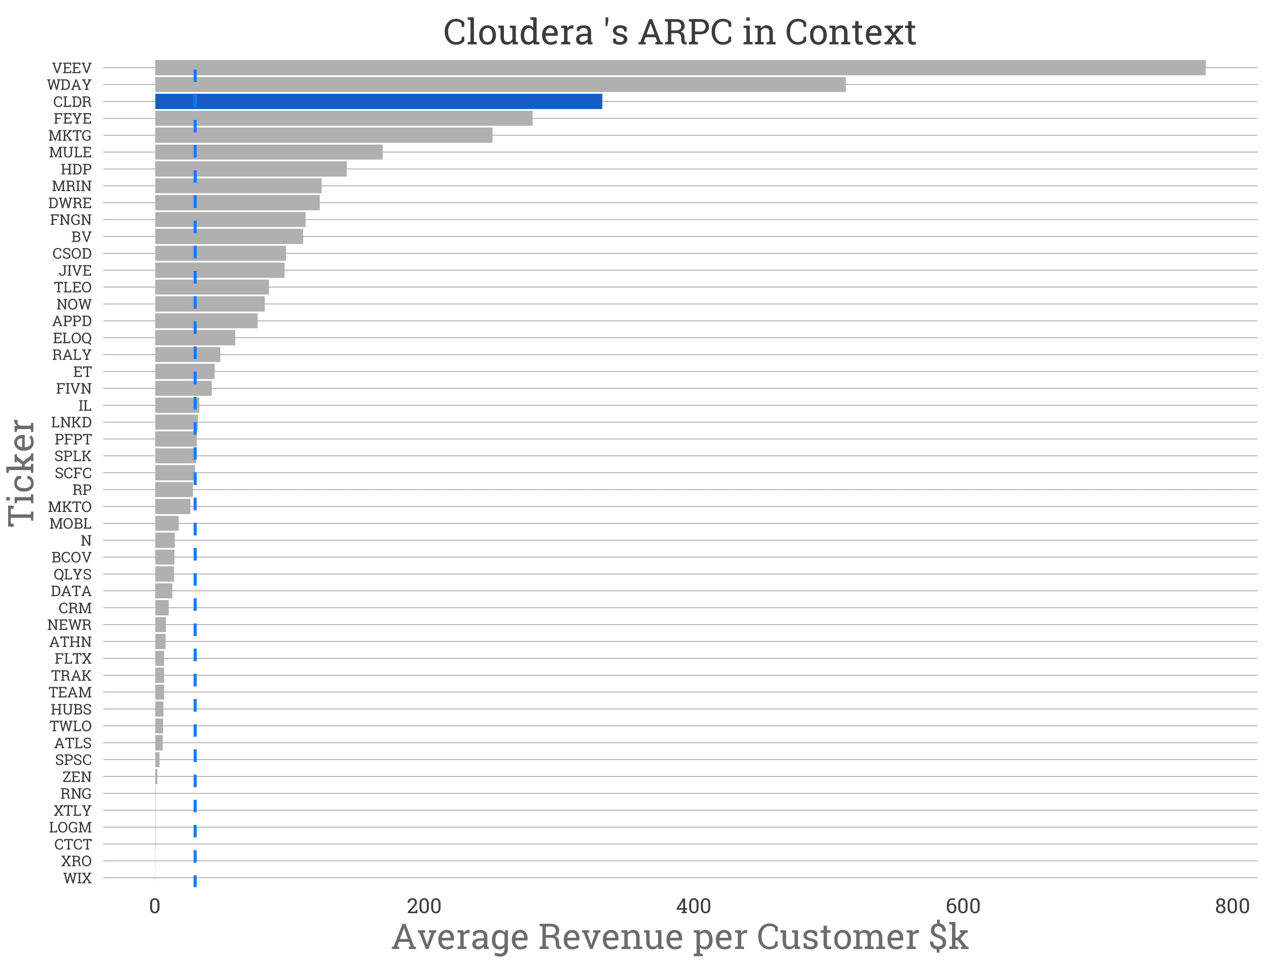
Cloudera generates about $332k per customer, placing it third on the list of software companies below Veeva and Workday. Hortonworks isn’t far off at $142k per customer at IPO, seventh on the list. Higher isn’t necessarily better, but likely reflect a larger initial customer contract for Cloudera. This could be a result of a larger initial deployment, a broader product sale or pricing power in the market.
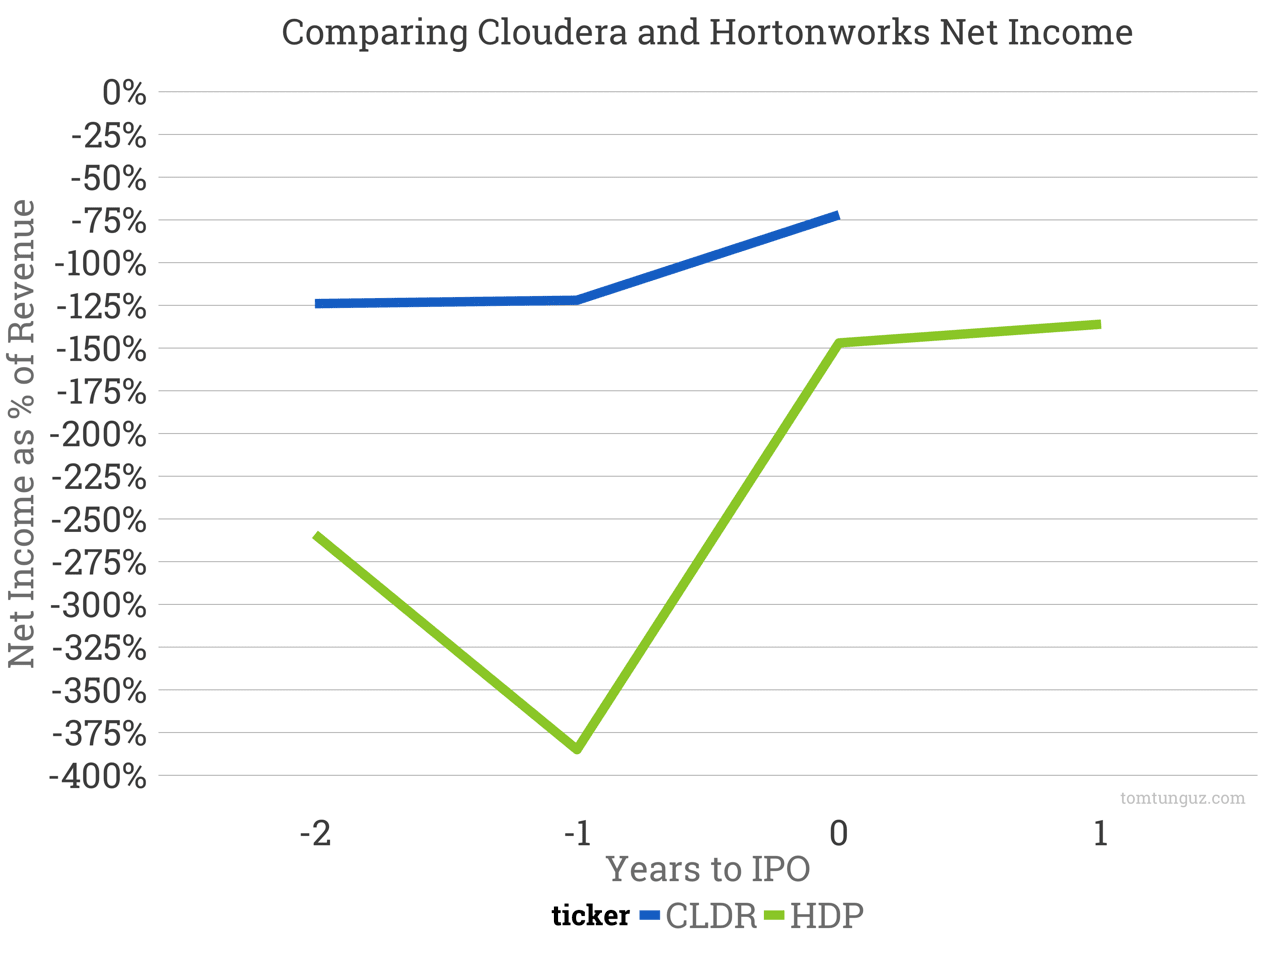
Let’s look at profitability. Both of these businesses generate substantial net income losses. The median public software company records -10% net income to revenue ratio. These two businesses burn much more: -72% for Cloudera and -137% for Hortonworks.
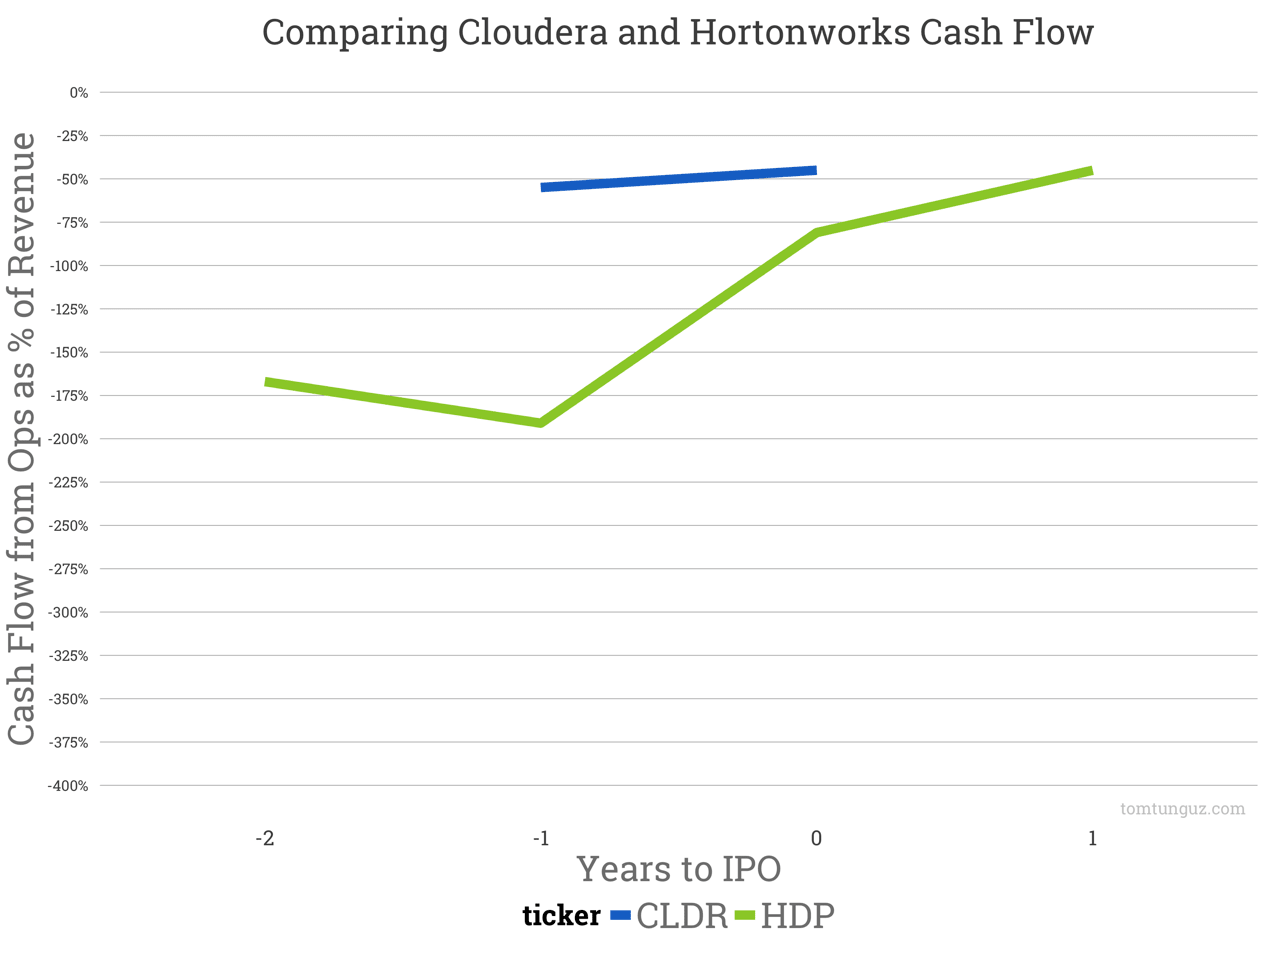
The cash burn story is a bit better. Cash flow from operations for both businesses is trending toward cash flow breakeven. The difference between net income and cash flow figures revolve around revenue recognition and how frequently customers pay for services up-front. For more, read this.
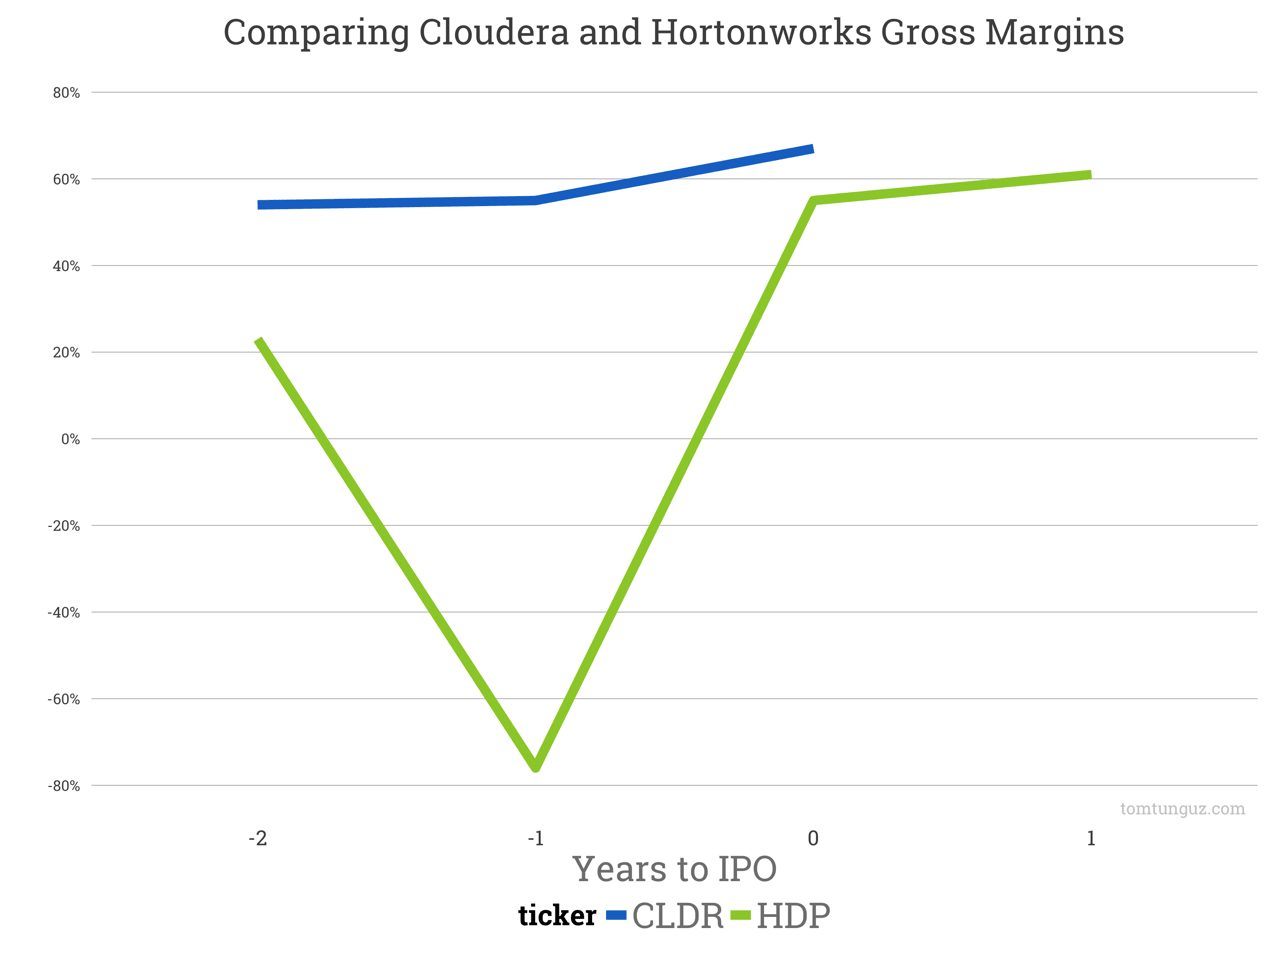
Cloudera generates 67 points of gross margin compared to Hortonworks’ 61 points. We can break that down into gross margin on the software and professional services. Cloudera generates more of their revenue through licenses, which also boosts their overall gross margin: 23% vs 31% for HDP.
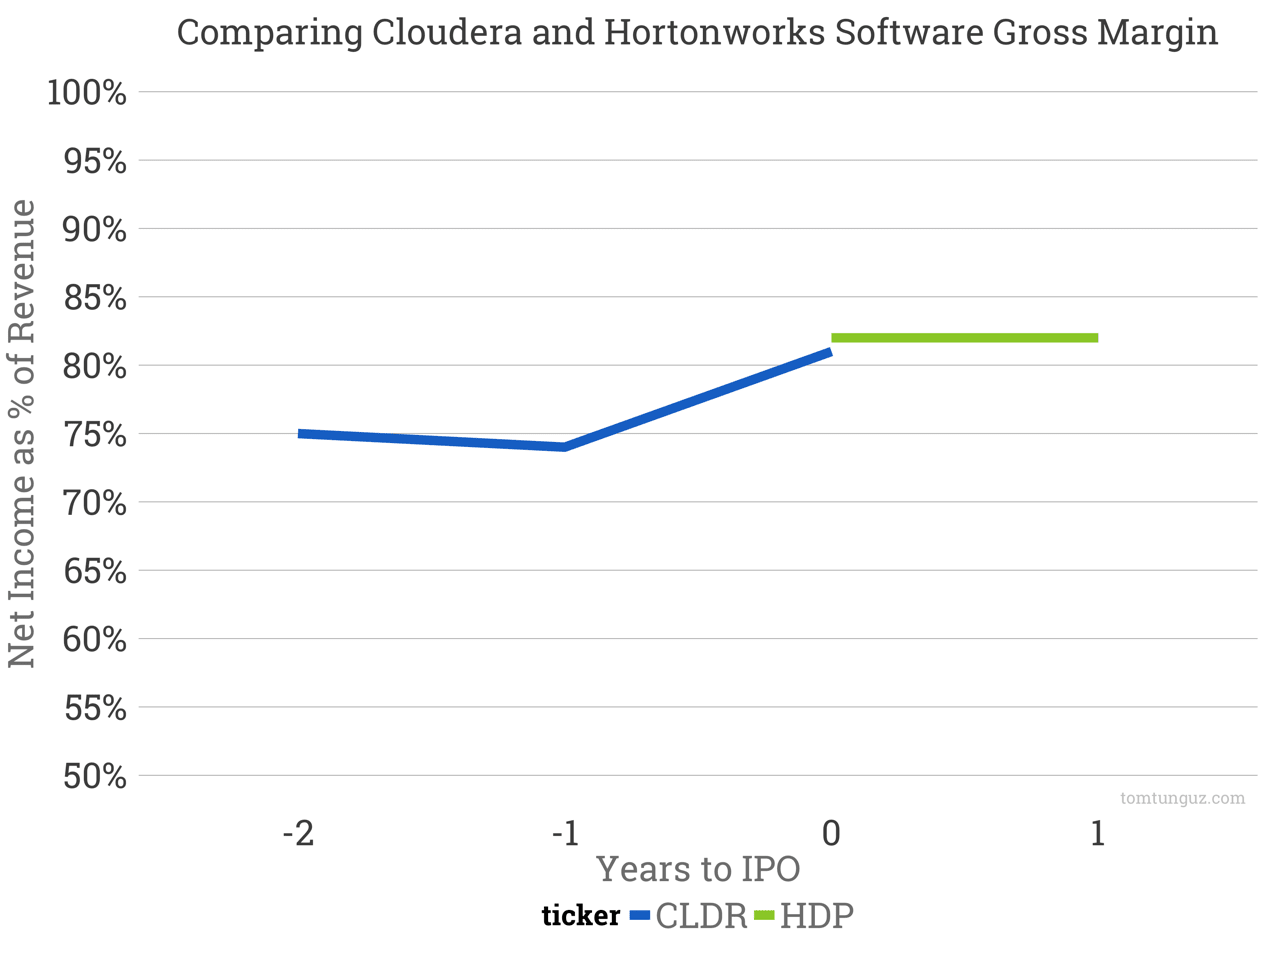
The companies are nearly identical in their software gross margins at 81% for Cloudera and 82% for Hortonworks.
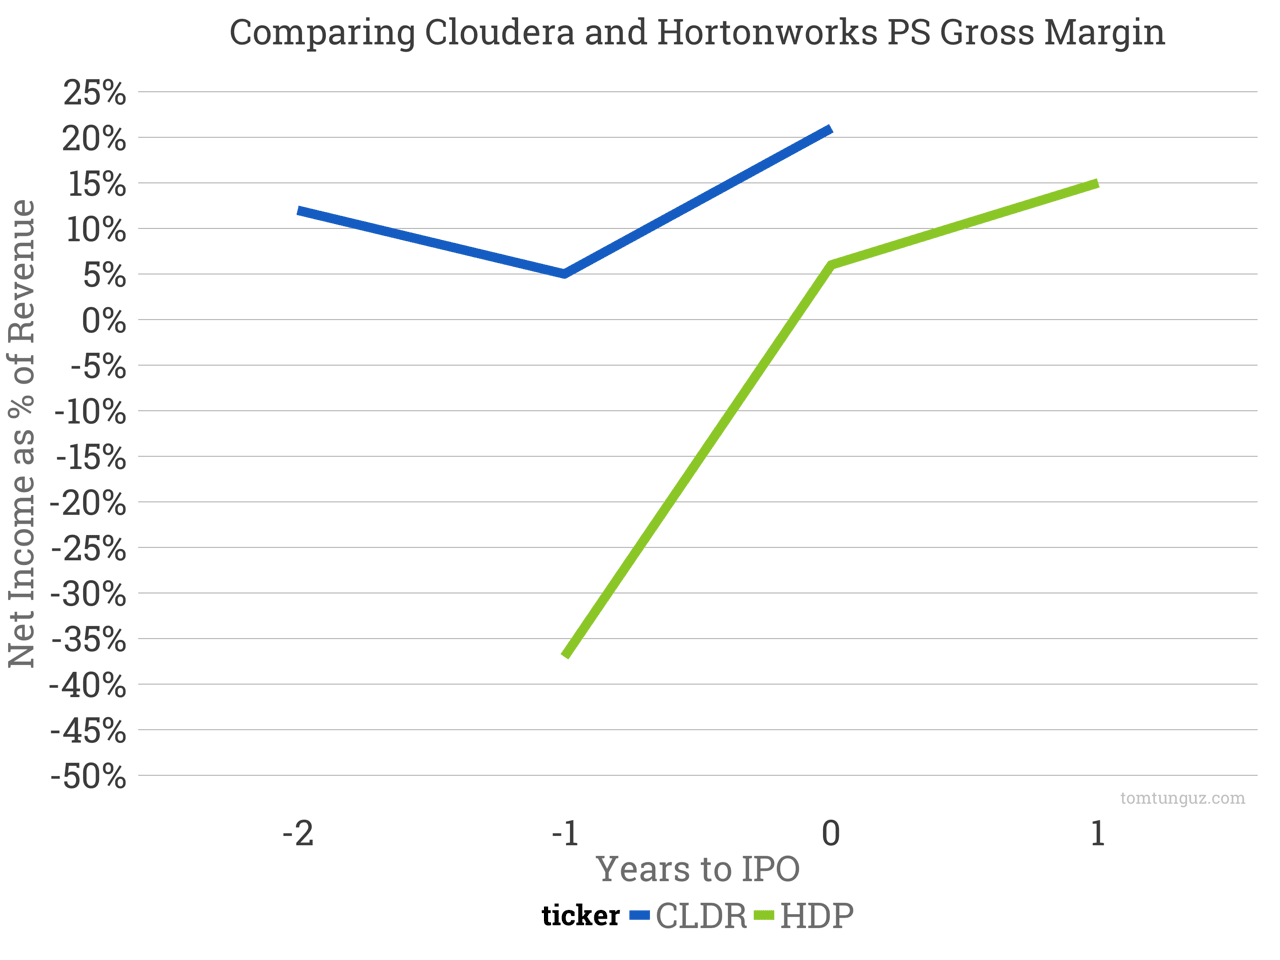
Professional services margin explains the overall difference. Cloudera generates 6 more points of gross margin in professional services: 21% vs 15%. In addition, Cloudera generates less of its revenue through services.
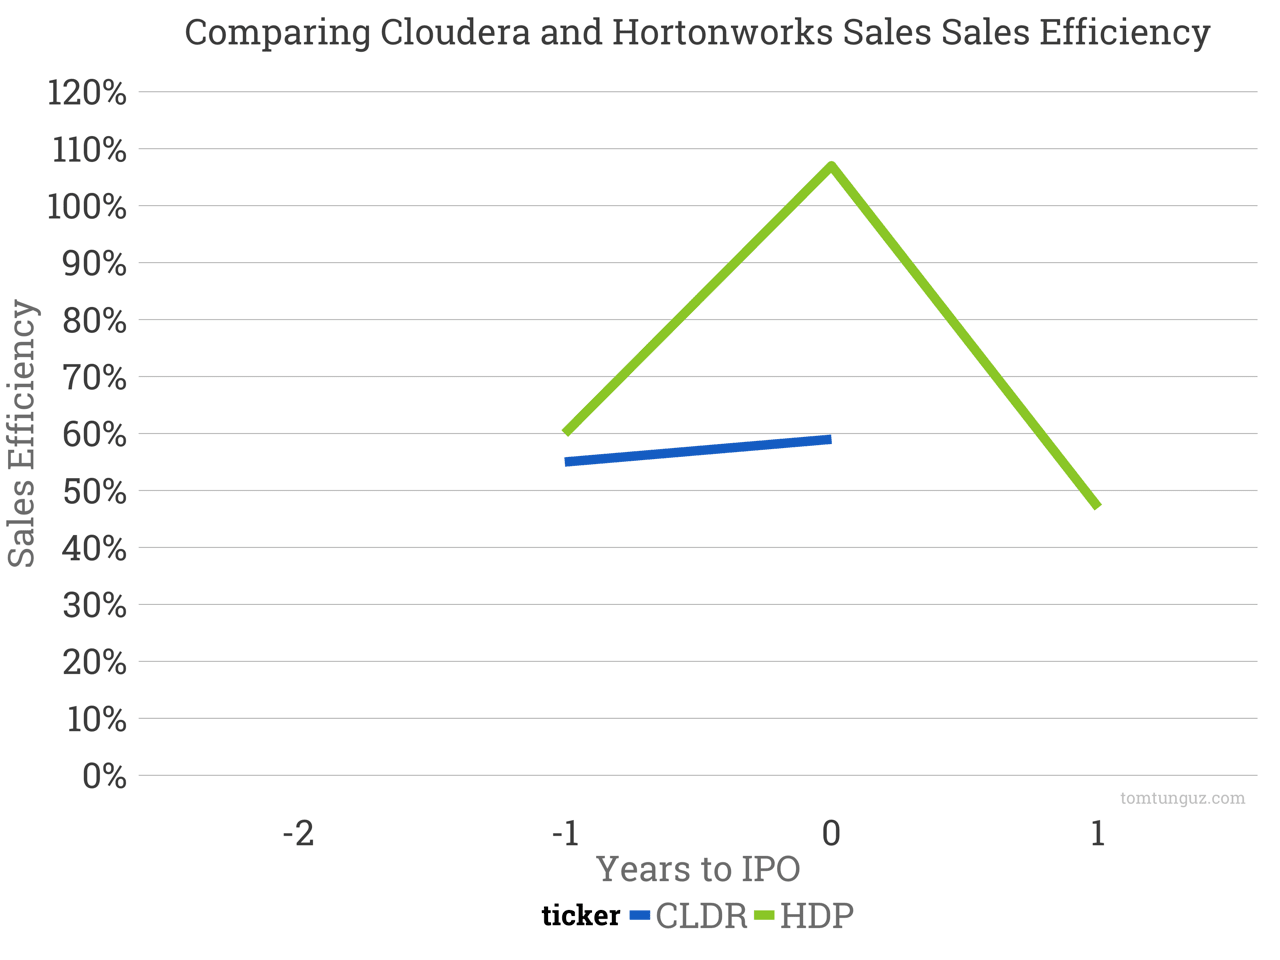
Cloudera also has an edge in estimated sales efficiency at 0.59 vs 0.47 for Hortonworks. This is likely due to a 2x increase in the average account size relative to HDP.
That’s a lot of charts already, but if you’re interested to see how Sales & Marketing spending and Research & Development spending differs, click on the links to see the charts.
In conclusion, Cloudera has built an immense business. It was the first company to commercialize Hadoop and has built an iconic brand inseparable from the category. Compared to Hortonworks, Cloudera is a bit bigger at IPO, more efficient in acquiring customers, and commands larger customer sizes. Congratulations to the Cloudera team on their success.