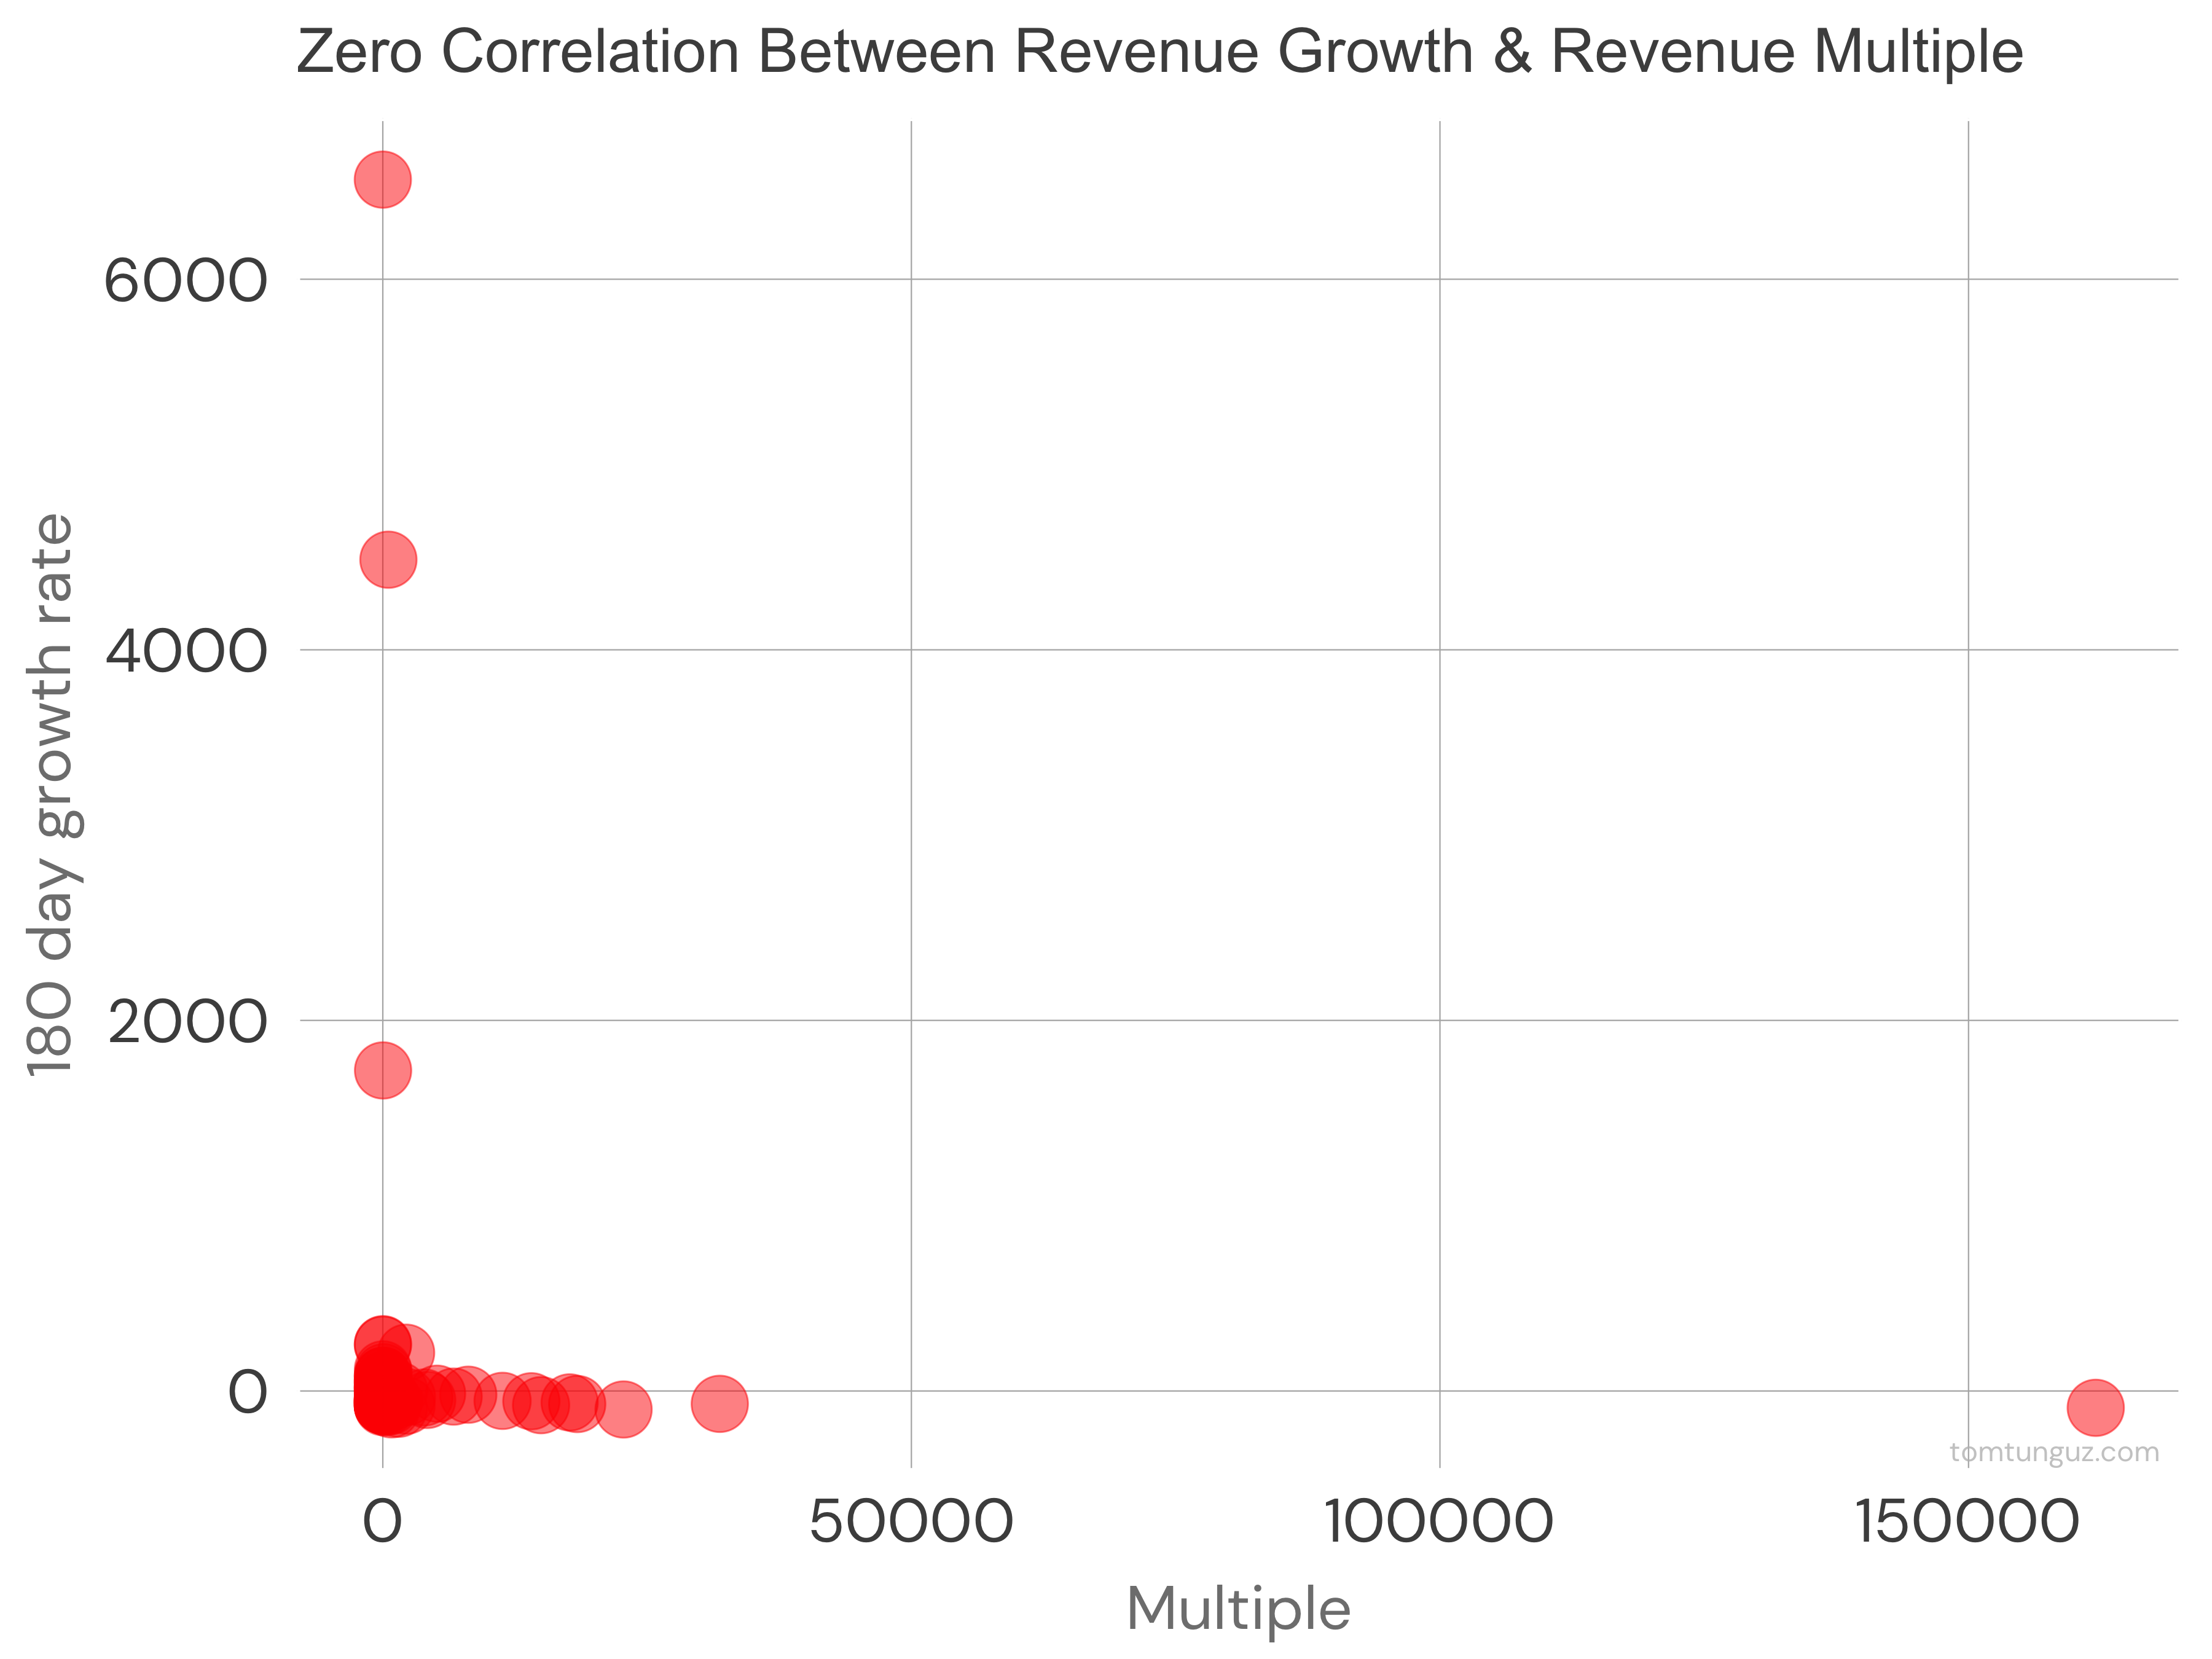
 This chart shows the relationship between the top 100 public projects’ revenue and their trailing revenue multiple. There’s none. The correlation asymptotes to zero. At least when looking at the ecosystem as a whole.
But let’s break the data down by category into the top 5 by revenue: L1s (blockchains), DEXs (decentralized exchanges), Credit (lenders), NFT Marketplaces (buy & sell Bored Apes), & Yield Aggregators (systems to maximize interest rates on deposits).
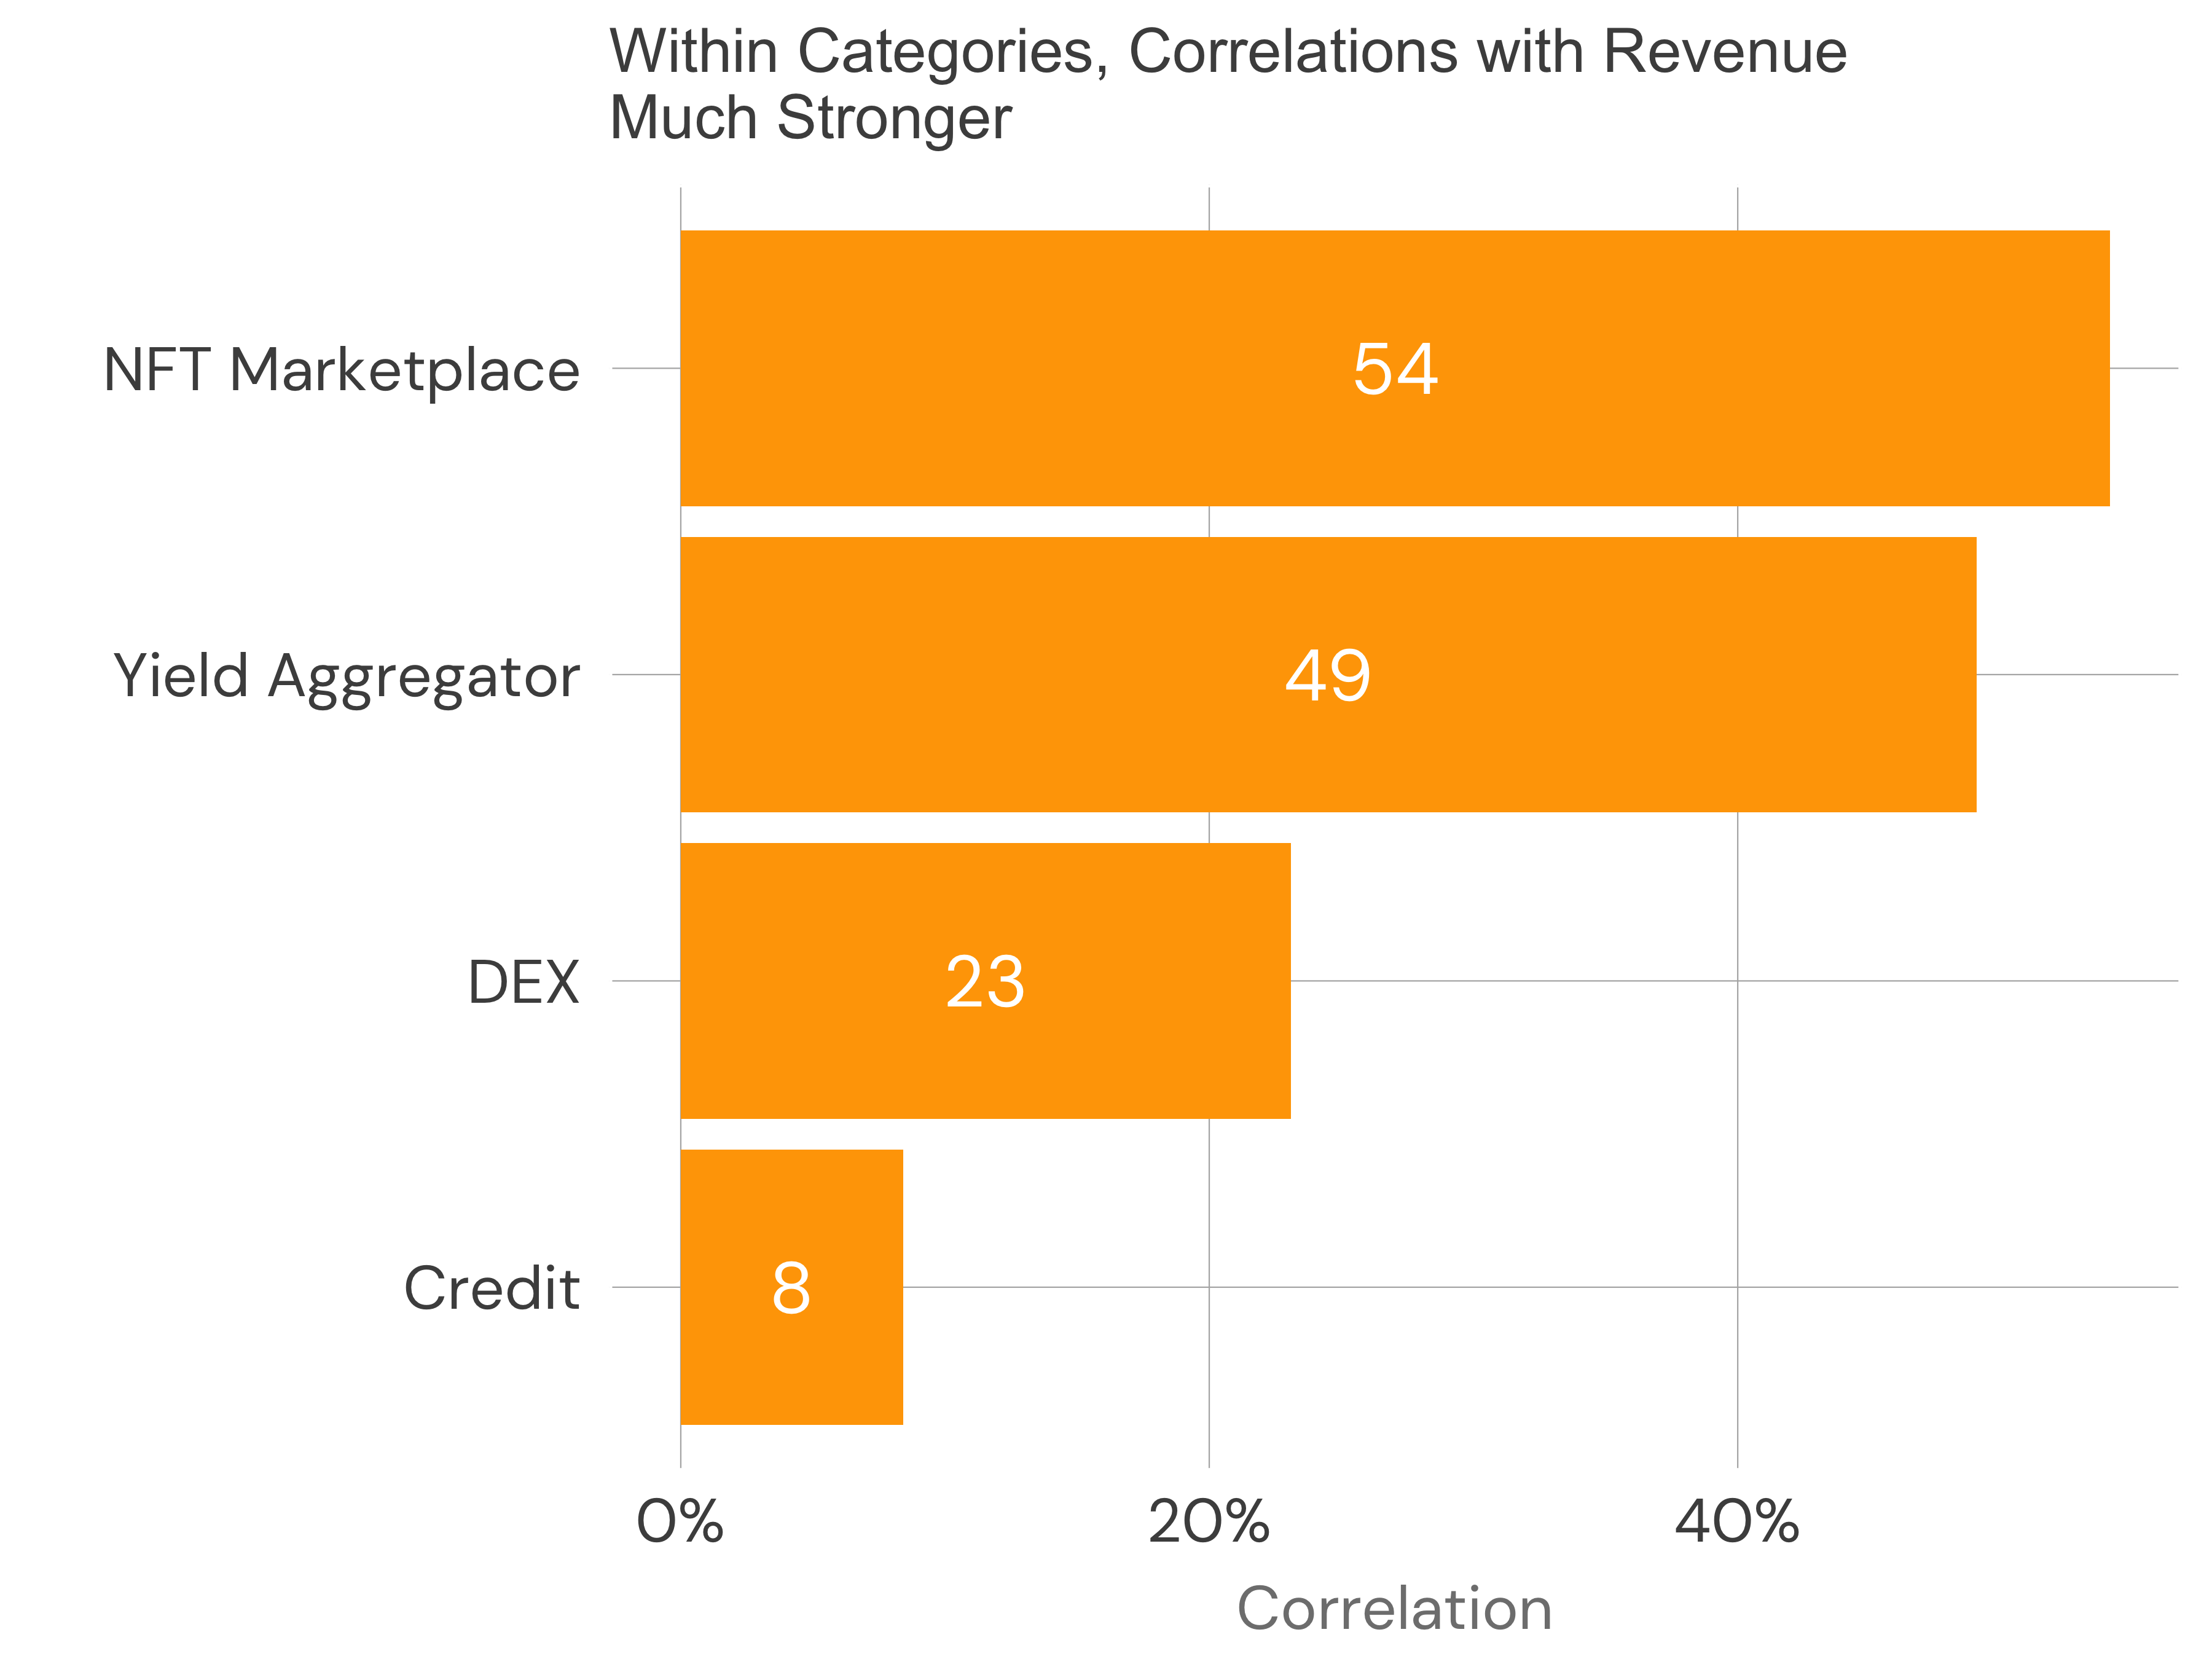
These correlations to revenue growth resemble web2 software companies in the strength of their correlation.
Two weeks ago, revenue growth correlated to public software companies multiple at 0.61 compared to 0.54 & 0.49 for NFT Marketplaces & Yield Aggregators. DEXs & Lenders are still mostly uncorrelated to revenue growth.
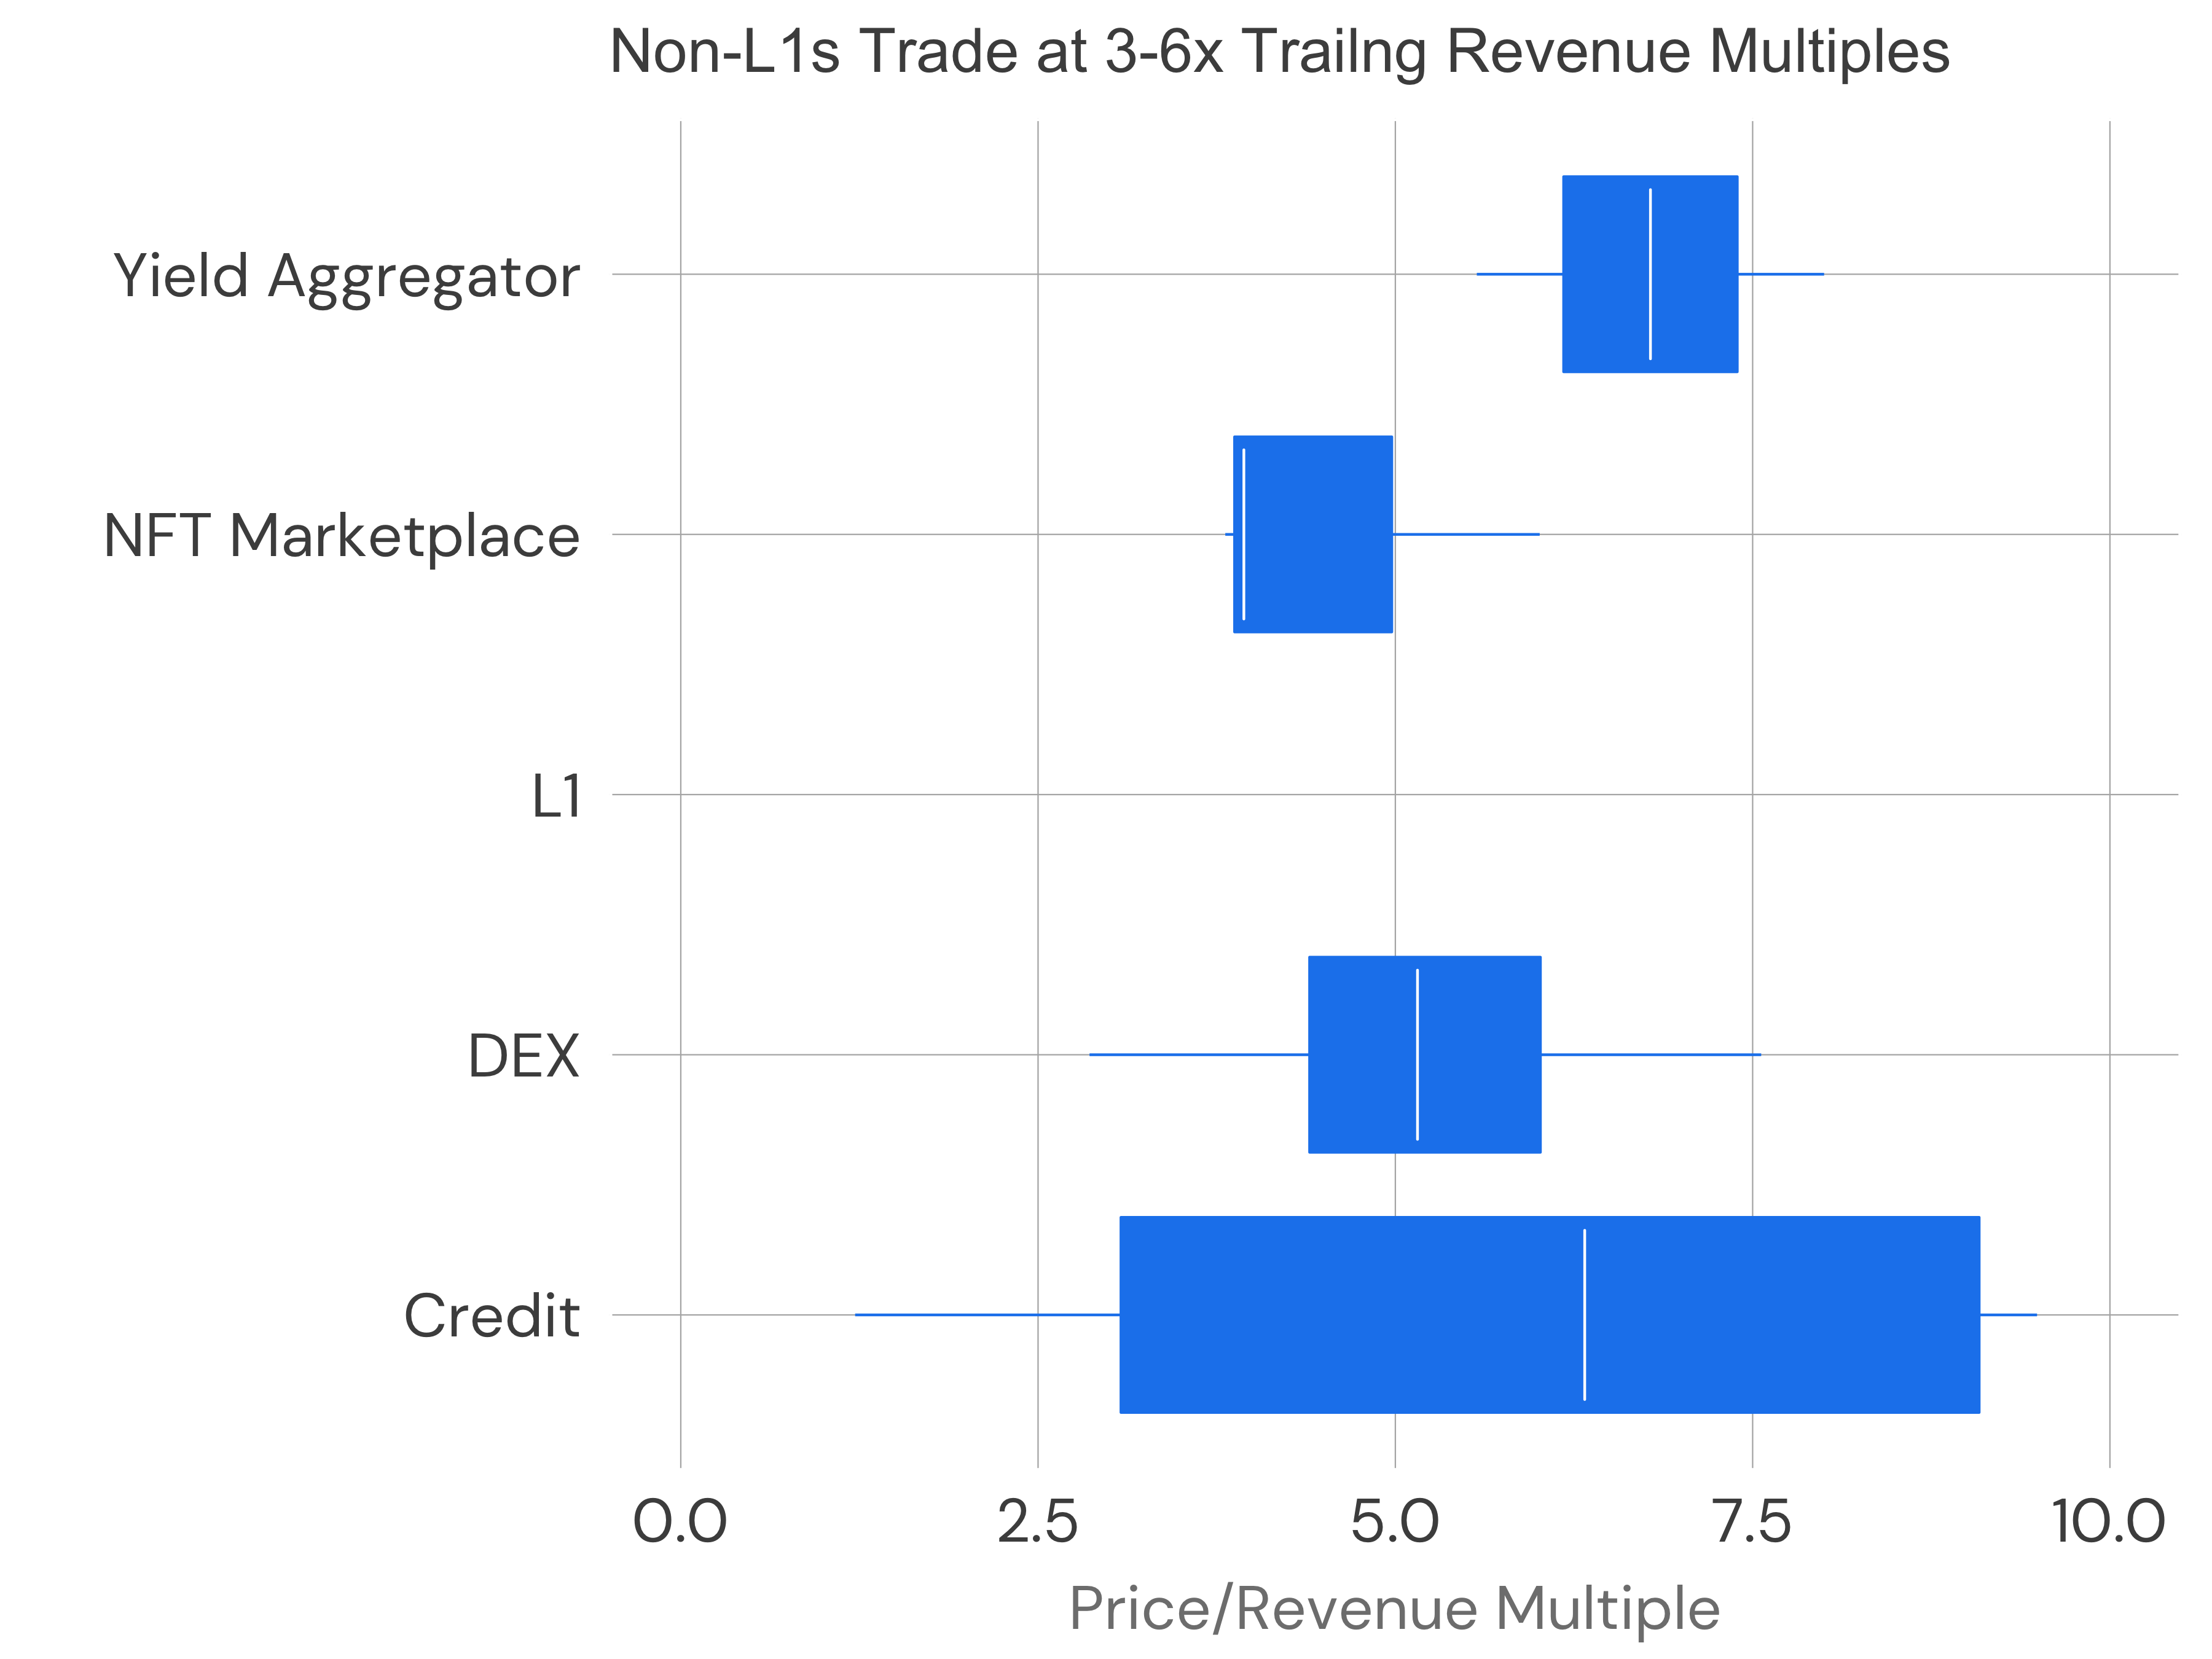 As for the multiples themselves, these four categories have multiples bounded between 3x - 9x, which resemble web2 businesses. L1s live off the chart, their multiples measured in the thousands!
| Market Places | TTM Multiple |
|---|---|
| Web2 Median | 3.3x |
| Web3 Median | 3.9x |
Web2 market places (a basket of etsy, eBay, Fiverr, & Udemy) trade at 3.3x trailing compared to 3.9x median for web3 NFT Marketplaces - strikingly similar, doubly so since I’m not normalizing for gross margin or any other metric.
| Exchanges | TTM Multiple |
|---|---|
| Web2 Median | 8.7x |
| Web3 Median | 11.9x |
Web2 exchanges (a basket of Intercontinental Exchange, Nasdaq, London Stock Exchange & the CME) trade at 8.7x trailing compared to 11.9x for the 21 DEXs in the top 100 web3 apps by revenue.
I’m not sure there’s a public market equivalent of a yield aggregator - maybe roboadvisors. The same is true of the crypto lending companies since they are a mix of secured & unsecured lending, so I’ll leave the comparison there. But I’m open to suggestions so message me with ideas.
For these two categories at least, investors have begun to value web2 & web3 businesses similarly. I wrote about other convergences between web2 & web3 in these predictions. In the end, an investor with a dollar must decide the best place to put it. So it stands to reason that similar companies should trade at similar multiples, irrespective of their underlying architecture (centralized vs decentralized).
The settling of multiples across the non-L1 categories should cascade to early stage valuations. Web2 & Web3 marketplaces should trade at similar prices irrespective of novel token dynamics. In addition, the market’s coalescence on classical valuation methods will focus web3 companies on revenue as a north star metric - something largely absent to this point. And for good reason: web3 remains in the installation phase of Carlota Perez’s framework.
L1s’ valuations remain unconstrained by comparables to others for the moment. L1s are indices on the entire market: they capture revenue across every application built & yet to be built. The colossal multiples suggest investors expect stratospheric revenue growth as developers adopt decentralized databases & infrastructures en masse.
All in all, this data suggests web3 continues to mature, an exciting prospect because as valuations normalize, more dollars, interest, & effort follow.