Just how much are we spending on AI?
Compared to other massive infrastructure projects, AI is the sixth largest in US history, so far.
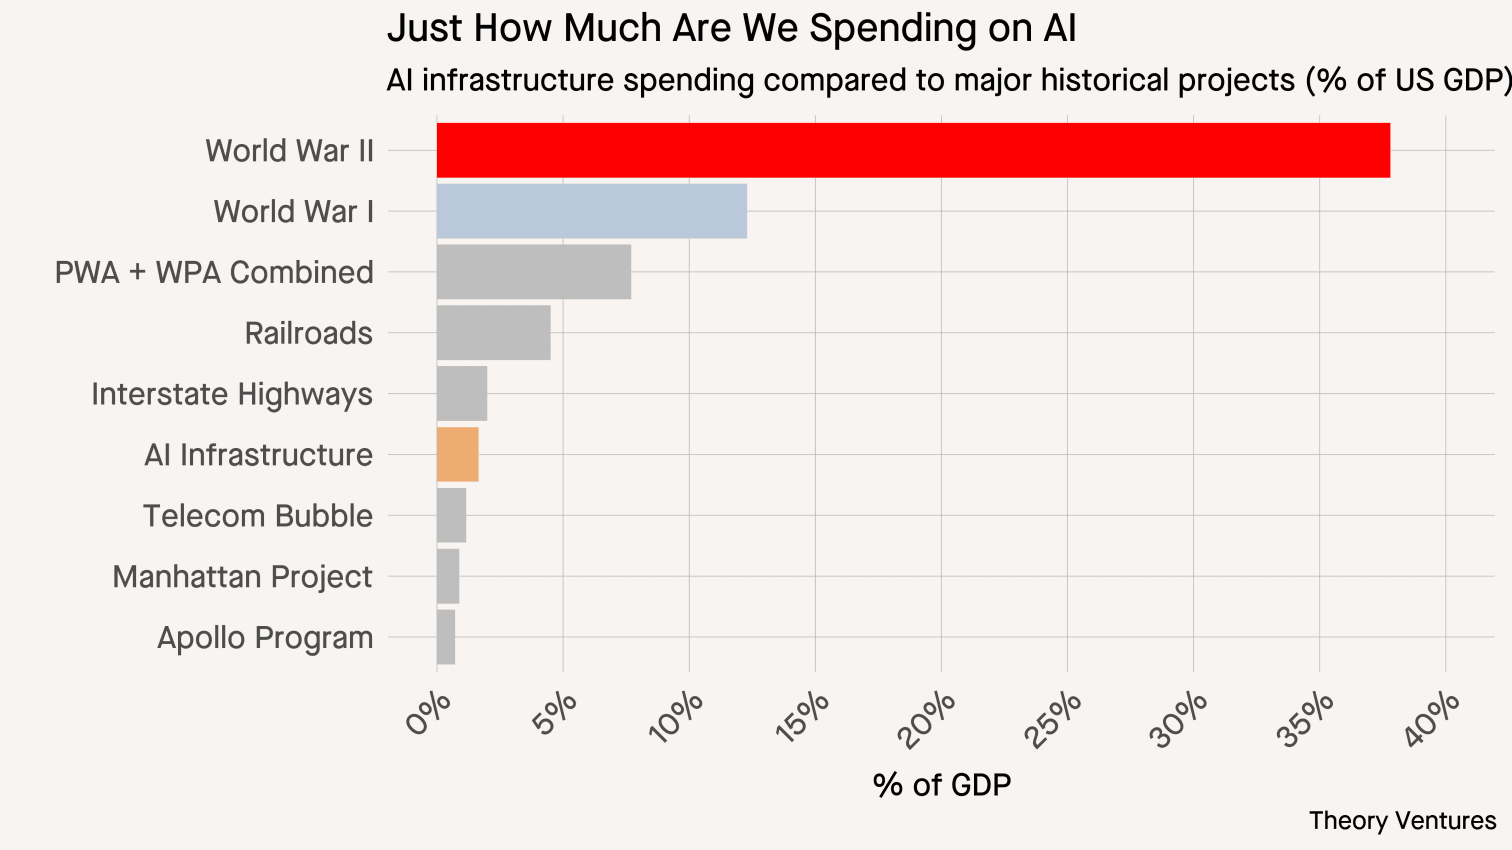
World War II dwarfs everything else at 37.8% of GDP. World War I consumed 12.3%. The New Deal peaked at 7.7%. Railroads during the Gilded Age reached 6.0%.
AI infrastructure today sits at 1.6%, just above the telecom bubble’s 1.2% & well below the major historical mobilizations.
| Project | Year | Spending (2025$) | % of GDP |
|---|---|---|---|
| World War II | 1944 | $1,152B | 37.8% |
| World War I | 1918 | $138B | 12.3% |
| New Deal | 1936 | $150B | 7.7% |
| Railroads (peak) | 1870 | $18B | 6.0% |
| Interstate Highways | 1964 | $142B | 2.0% |
| AI Infrastructure | 2024 | $500B | 1.6% |
| Telecom Bubble | 2000 | $226B | 1.2% |
| Manhattan Project | 1945 | $36B | 0.9% |
| Apollo Program | 1966 | $59B | 0.7% |
Companies like Microsoft, Google, & Meta are investing $140B, $92B, & $71B respectively in data centers & GPUs. OpenAI plans to spend $295B in 2030 alone.
If we assume OpenAI represents 30% of the market, total AI infrastructure spending would reach $983B annually by 2030, or 2.8% of GDP.1
| Scenario | 2024 | 2030 | % of GDP (2030) |
|---|---|---|---|
| Current AI Infrastructure | $500B | - | 1.6% |
| OpenAI Projected Spending | - | $295B | 0.8% |
| Total Market (projected) | - | $983B | 2.8% |
To match the railroad era’s 6% of GDP, AI spending would need to reach $2.1T per year by 2030 (6% of projected $35.4T GDP), a 320% increase from today’s $500B. That would require Google, Meta, OpenAI, & Microsoft each investing $500-700B per year, a 5-7x increase from today’s levels.
And that should give you a sense of how much we were spending on railroads 150 years ago!
Sources
World War I & II:
- NBER: The Economics of World War I
- EH.net: U.S. Economy in World War I
- St. Louis Fed: Which War Saw the Highest Defense Spending?
- EH.net: The American Economy during World War II
New Deal:
Railroads:
- Melville J. Ulmer, “Capital in Transportation, Communications, & Public Utilities: Its Formation & Financing” (1960), via Silicon Valley Capital Partners
- NBER: Railroads & Economic Growth in the Antebellum United States
- American-Rails.com: Railroads In The Gilded Age
Telecom Bubble:
Apollo Program:
- NASA: Apollo Program Budget Appropriations
- The Planetary Society: How much did the Apollo program cost?
Manhattan Project:
- Brookings Institution: The Costs of the Manhattan Project
- Nuclear Secrecy Blog: The price of the Manhattan Project
AI Infrastructure:
- Microsoft, Google/Alphabet, Meta earnings reports & CAPEX guidance (FY24-25)
- Bureau of Economic Analysis: US GDP Data
Methodology
All historical spending figures are adjusted to 2025 dollars using Consumer Price Index (CPI) inflation data. Each figure represents peak single-year spending in the year indicated. Percentages show spending as a share of GDP in that specific year, not as a percentage of today’s GDP.
For example, WWII’s $1,152B represents actual 1944 defense spending ($63B nominal) adjusted for inflation, which consumed 37.8% of 1944’s GDP ($175B). This differs from asking “what would 37.8% of today’s $30.5T GDP cost?” which would yield $11.5T.
-
Assuming 2.5% annual GDP growth to $35.4T in 2030 ↩︎