2 minute read / Aug 25, 2014 /
The Impact of a Startup's Location on its Acquisition Potential
Does a startup’s location impact its M&A prospects? We’ve already determined there is no material difference between the follow-on financing rates by geography. But do acquirers behave similarly to investors?
To answer the question, I’ve prepared three charts used Crunchbase data and focused on the seven states with more than 20 acquisitions since 2010. In the first two charts, we’ll compare the share of acquisitions by state to the share of financings by state in both number and dollar value, to get a sense of relative performance by state. The third chart shows the distribution of acquisitions by state.
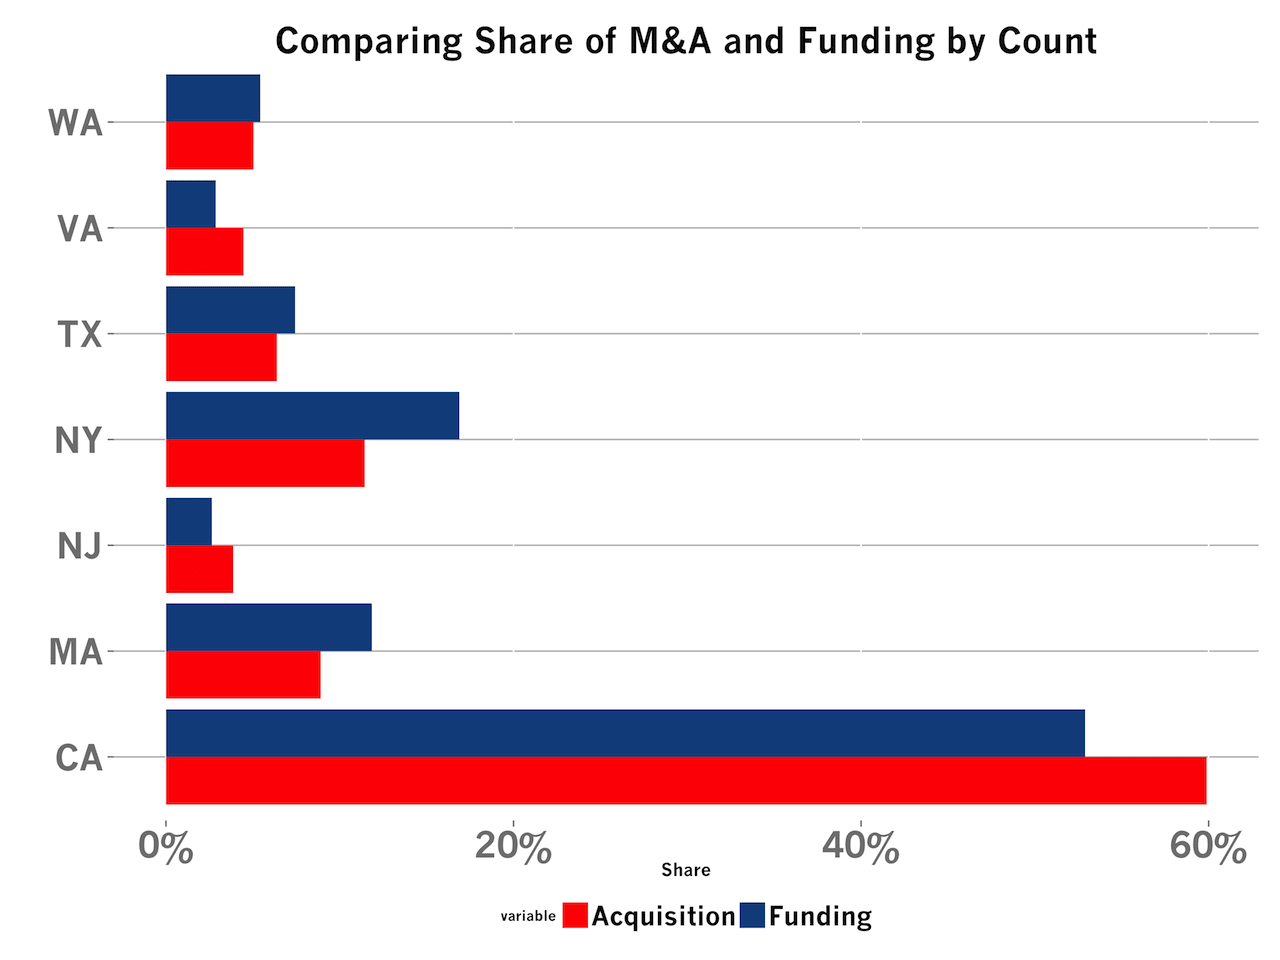
The chart at the top of the post plots the share by state of number of acquisitions and financings. Californian startups raise 53% of the rounds in this subset of state but see 60% of the acquisitions. It’s the only state to see a higher ratio of acquisitions than financings, although the difference is slight.
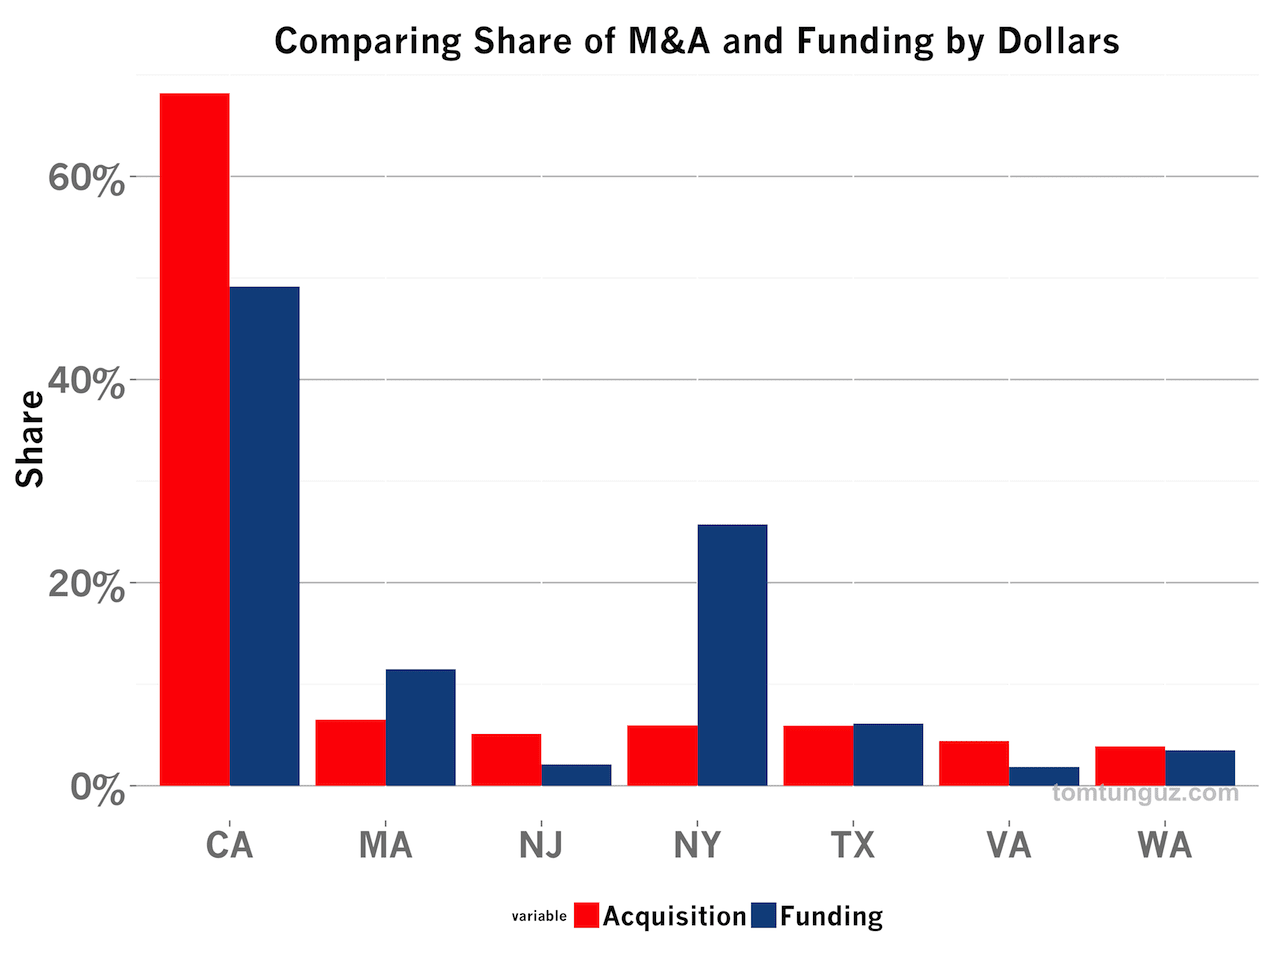
When looking at share by dollars, the story is a bit more skewed. Californian startup raise 49% of all the dollars among these seven states, but command 68% of the M&A dollars. NY startups see a very different pattern, raising 26% of the venture dollars and receiving 6.5% of the acquisition dollars.
The Californian figures are much different than the rest of the country for a few reasons. First, a small number of very large acquisitions like WhatsApp skew the numbers. Power laws seem to govern startups and these figures are subject to that influence.
Second, there is an important timing difference between the financings and acquisitions. In other words, the analysis doesn’t track whether the startups of 2010 become acquired a few years later; I’m simply adding the up the financing dollars and adding up the acquisition dollars and making a comparison. The New York startup scene has boomed in the last five or so years, but since the average time to acquisition for a startup is around seven, this latency disproportionately impacts relatively new startup states.
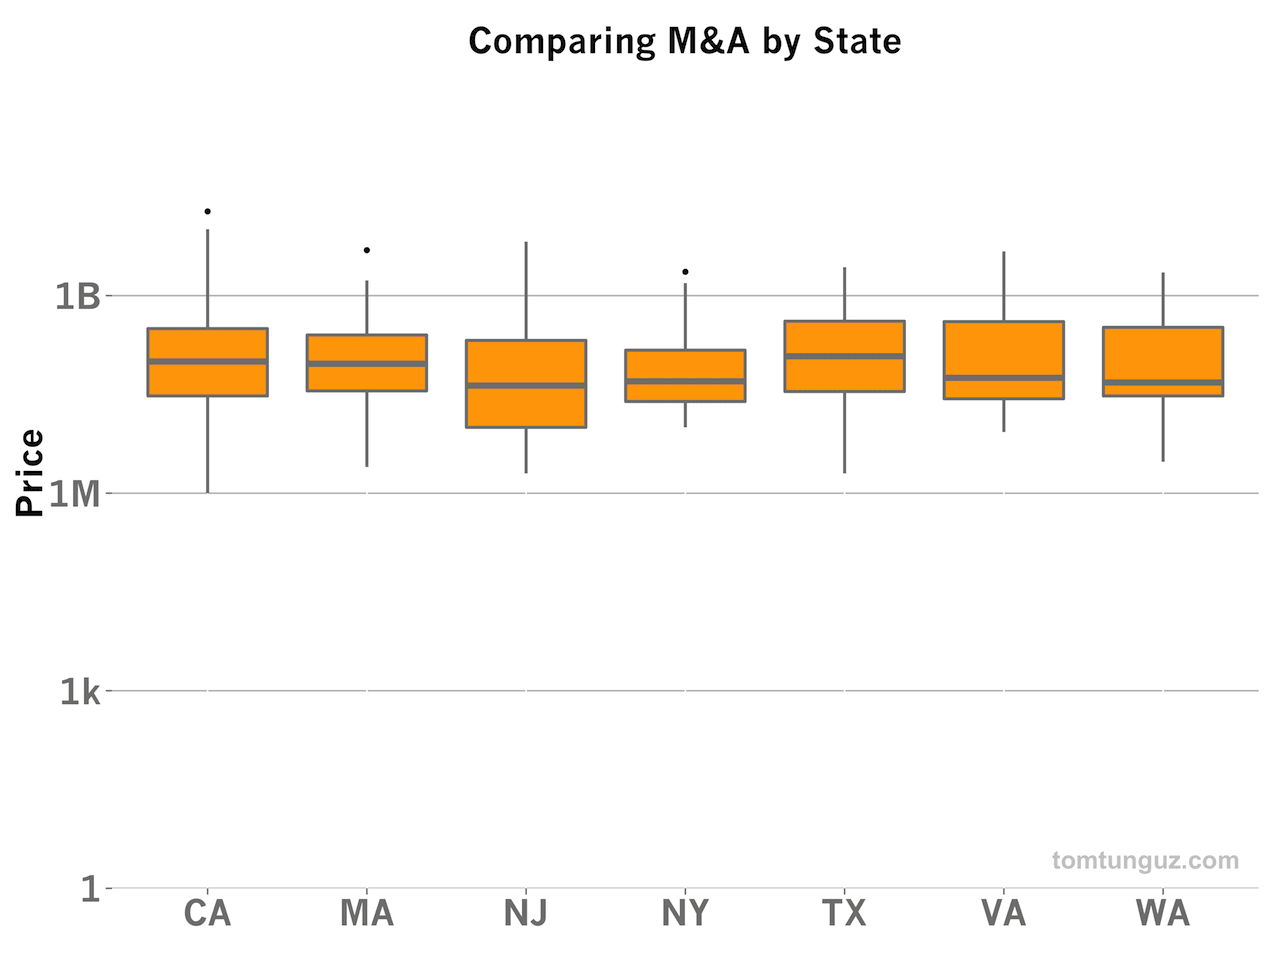
The last and most telling chart shows the distribution of M&A outcomes by state. There is no statistically significant difference between the acquisition prices across any of these states to better than 95% confidence. In other words, like the financing market, the acquisition market is highly efficient - great companies fetch terrific prices in each of these seven states.