Bill Gurley and Fred Wilson have focused on burn rates as an important topic for startups. The immediate question that follows this commentary is: How much does the typical startup burn throughout its life? And what is a “risky” burn rate for a company?
I use a rule of thumb to evaluate the burn rate of a Series A startup. I multiply the number of employees by about $10-12k, depending on the location of the company. For example, Bay Area salaries are higher than most other places. If a startup’s current burn rate substantially exceeds the this heuristic, I ask why. But like many others, this shortcut isn’t rooted in analysis.
Using a basket of about 60 publicly traded consumer and SaaS companies, I aggregated the net income patterns by years-since-founding. I eliminated outliers to concentrate on the patterns of the “typical” public startup.
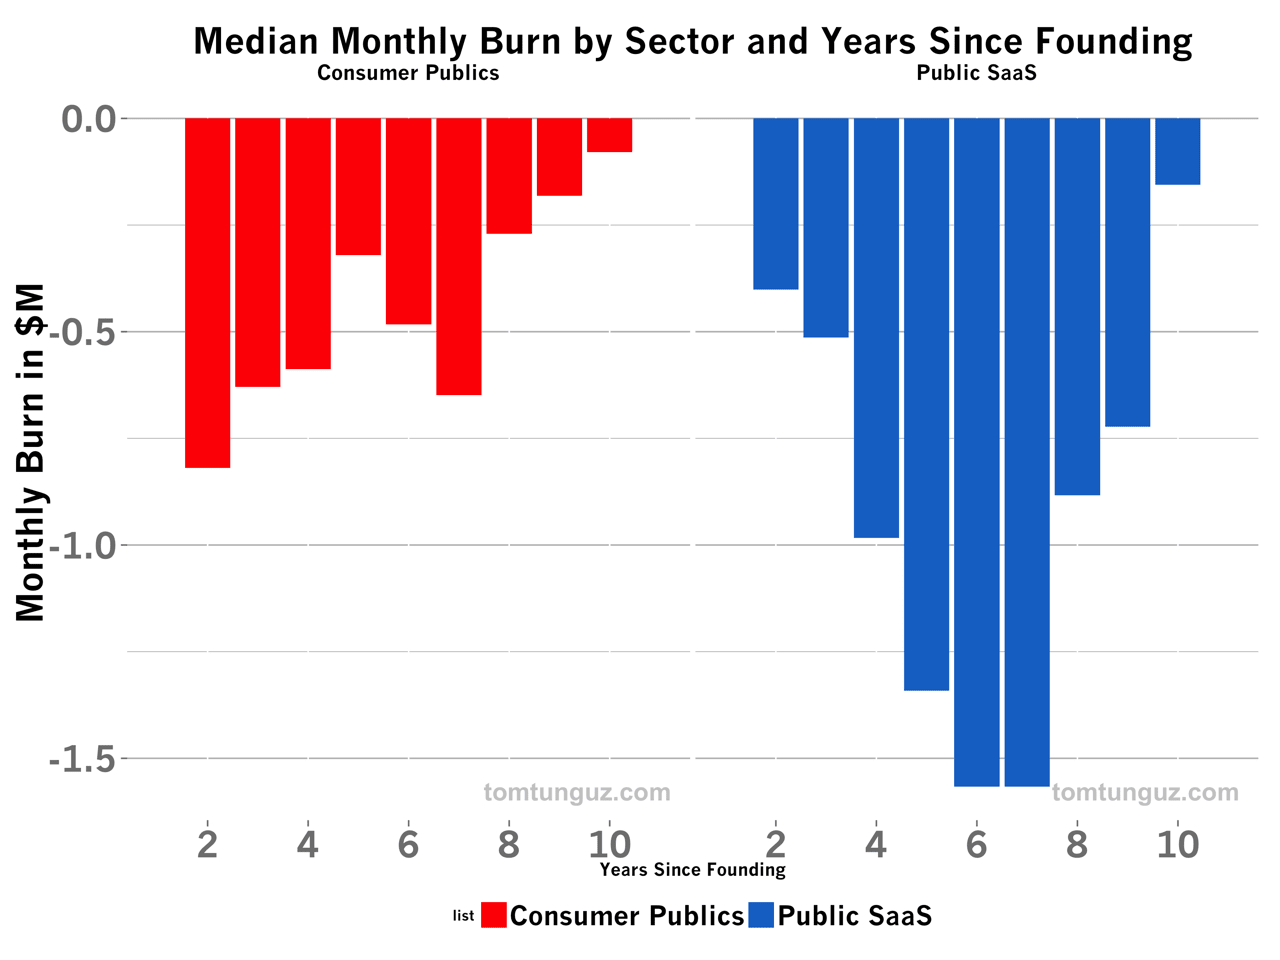
The bar chart above shows the median monthly net income by sector and years-since-founding. A few patterns emerge from the data.
Consumer Companies
- Consumer companies tend to burn more cash in the earlier years than SaaS companies. This is likely because some consumer companies in the basket delay revenue until achieving large-scale consumer adoption.
- As consumer companies begin to weave their revenue models into their businesses, net income patterns decline progressively through to year 10, at which point the business nears profitability.
- The median consumer public startup doesn’t exceed $1M in monthly burn rate at any point during its life.
SaaS Companies
- In SaaS companies, the burn rate is either equal to or smaller than consumer companies in years 2 and 3.
- In year 4, the paths diverge. SaaS companies, presumably having achieved product market fit, quickly hire large sales and marketing teams. Sales teams require a certain amount of time to learn the product, the sales pitch and build a book of business to eventually achieve quota. During the intervening few months, the company pays a carrying cost of the sales salaries that are not yet offset by bookings or revenue, thereby depressing net income.
- The median public SaaS company burns $1M or less per month for the first four years. As the business scales, this figure jumps to about $1.5M, at which point the company goes public. Having raised additional capital and subject to additional scrutiny of public investors, burn falls again to sub-$1M per month.
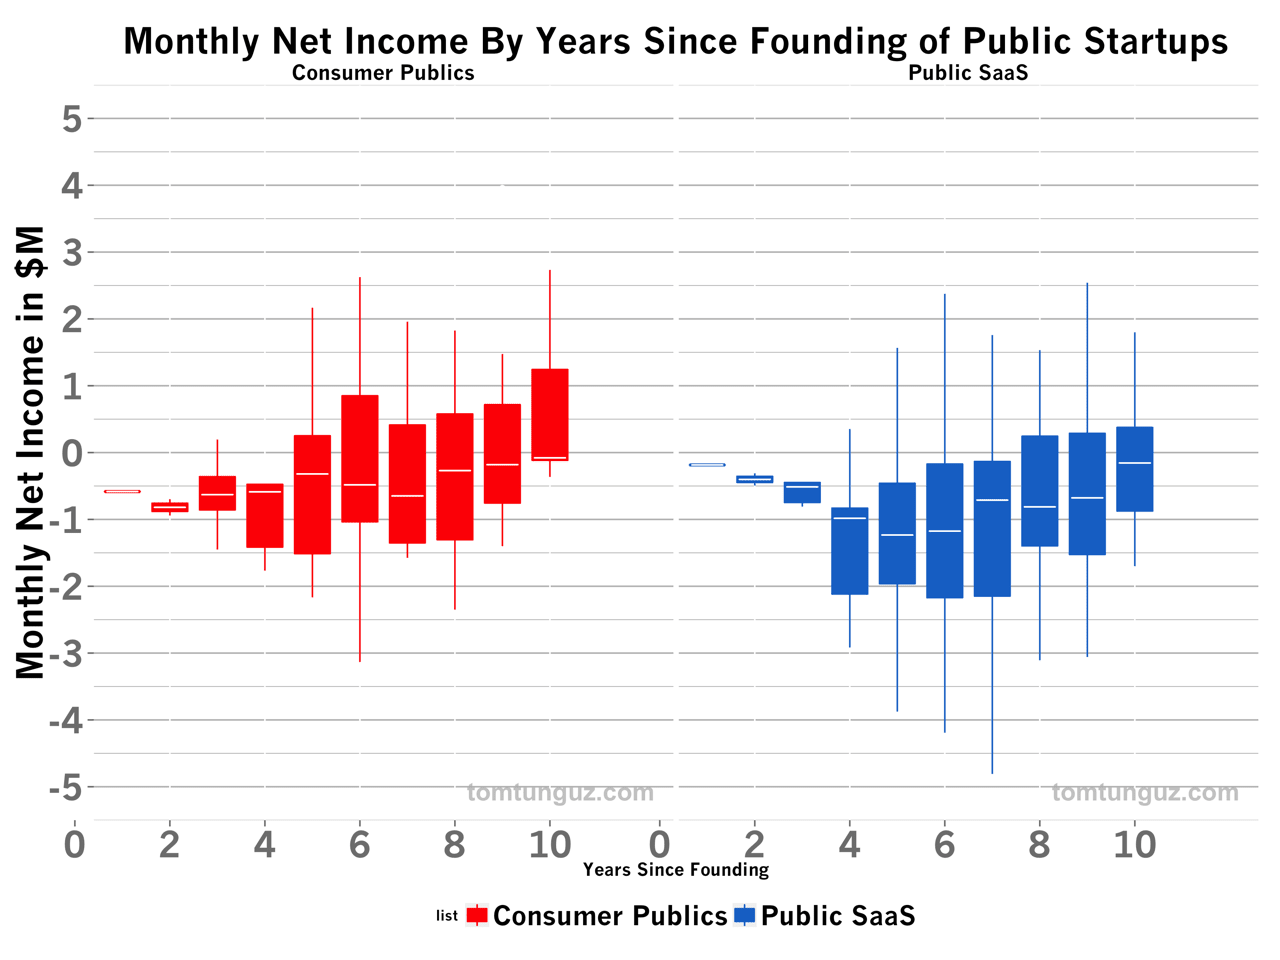
Of course, the medians don’t express the variance within the data. I’ve plotted a box plot by sector of the same data. The median values are marked by white lines in the boxes. The 25% and 75% percentile values are the edges of the boxes and the extremes of the whiskers indicate the 5% and 95% percentiles. Again, I’ve omitted the outliers.
Now that we’ve established some benchmarks, let’s return to the question of the “risky” burn rate. There is no precise answer for every company as to what a risky burn rate and what a conservative burn rate might be.
But there are a few factors to consider. First, the ability of the team and the business to continue to raise capital are the most important factors. Part of this ability lies within the team, and the team’s ability to position and sell the story of the business. Another component is the market’s receptivity to the story given the financial conditions of the market, which is harder to gauge and difficult to predict.
Second, the current runway or months-of-cash remaining as compared to the timing of the next milestone. Ideally, companies count 6 to 9 months of cash on their balance sheets when they attain the target milestones to raise their next round.
Third, the unit economics of the business matter a great deal. If the unit economics of a startup are strong, that’s a great leading indicator to finance growth and increase burn. If the company hasn’t yet achieved contribution break even, then it’s often prudent for the business to reduce spend until the math is proven out.
One of the main responsibilities of the management team and the board is cash management and financial planning. Understanding the impact of the business’s burn rate is an essential component of this responsibility. Benchmarks like the ones above can help, but should be used in conjunction with milestone planning for fundraising.
Note: I analyzed net income, not free cash flow, for startups mostly because the data is more readily available. But for certain businesses, FCF can be a better metric to evaluate true cash burn than net income.