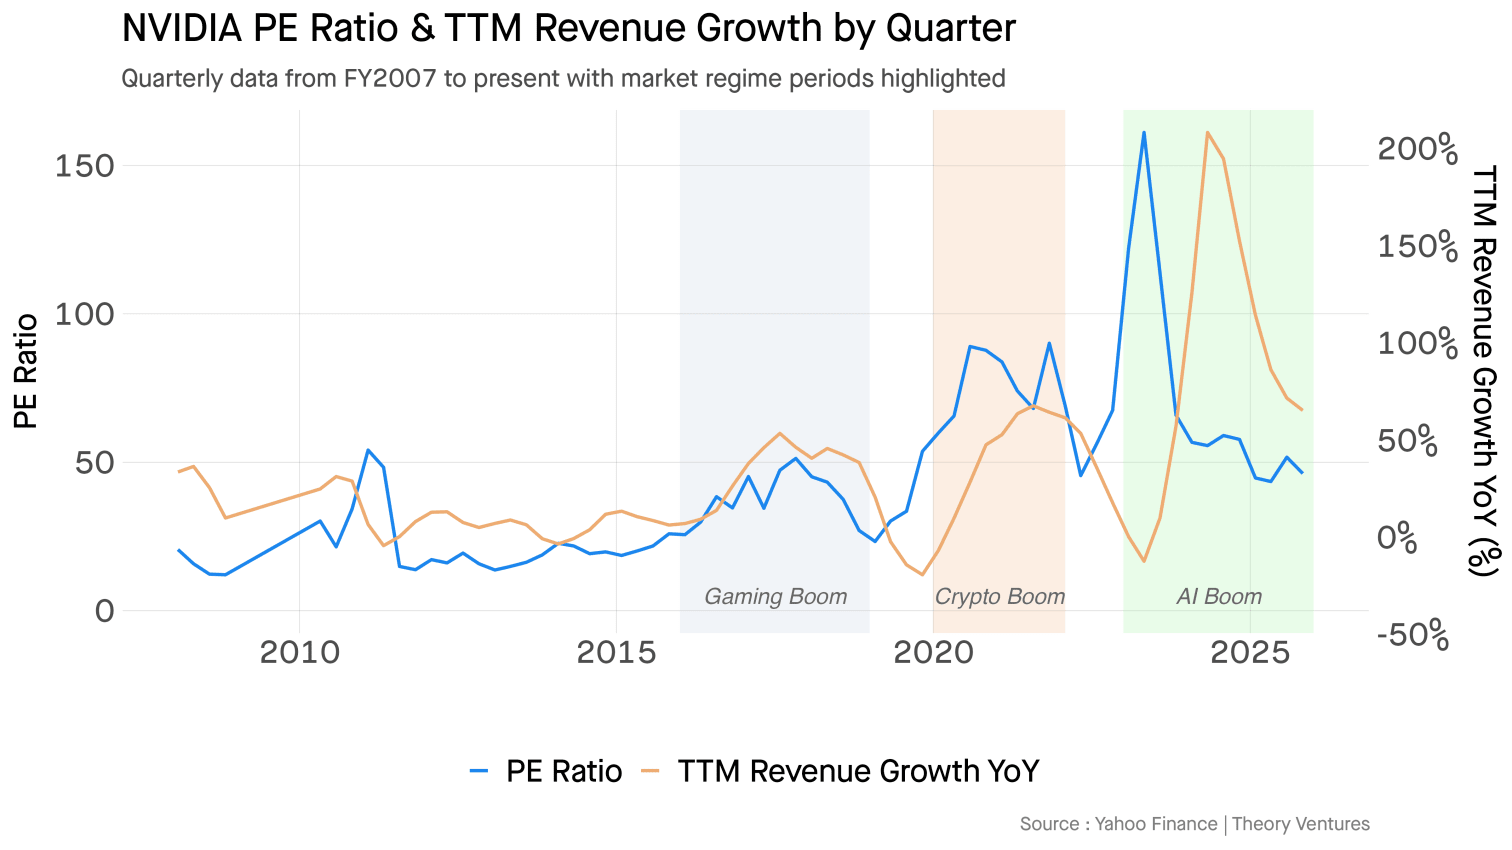
AI is NVIDIA’s third climb up a steep slope.
First came gaming in the late 2010s.
Then cryptocurrency.
Now artificial intelligence.
Each wave pushed revenue growth above 50% & with it, P/E1 ratios surged. P/E ratios rose before the revenue growth materialized.
There’s a four-quarter offset between P/E ratio & TTM2 revenue growth. When you shift revenue growth forward by a year, the correlation with P/E jumps to 0.80.
Investors buy stocks based on where they think the company is headed, not where it’s been. A high P/E today reflects expectations of strong revenue growth tomorrow. During NVIDIA’s climb up each wave, P/E & future growth move in lockstep.
But look at what happens at the peaks.
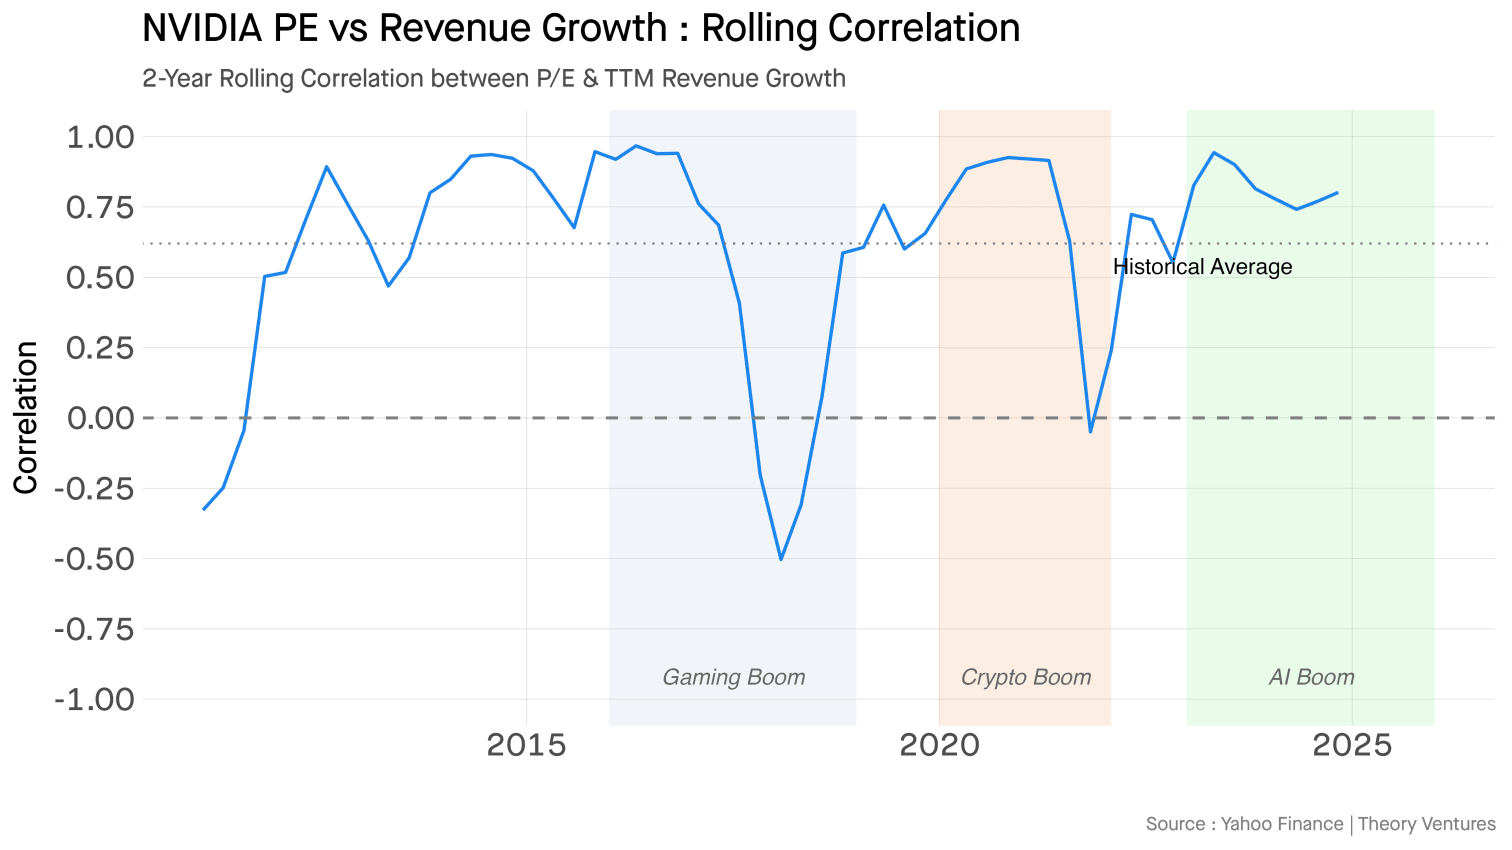
At the end of each boom, the correlation collapses, falling to zero or even turning negative. P/E stays elevated while revenue growth plummets. The market is slow to reprice.
This is the pattern : during the ascent, P/E & growth are tightly linked. At the peak, they decouple. High P/E persists as growth dissipates.
Today’s AI wave is riding the same mesa. The correlation remains above historical levels. The rapid pace of deal-making & explosive rates of inference growth suggest this roller coaster ride will continue.