Napoleon's Influence on the Modern Data Stack : hyperdimensional Analysis with Malloy
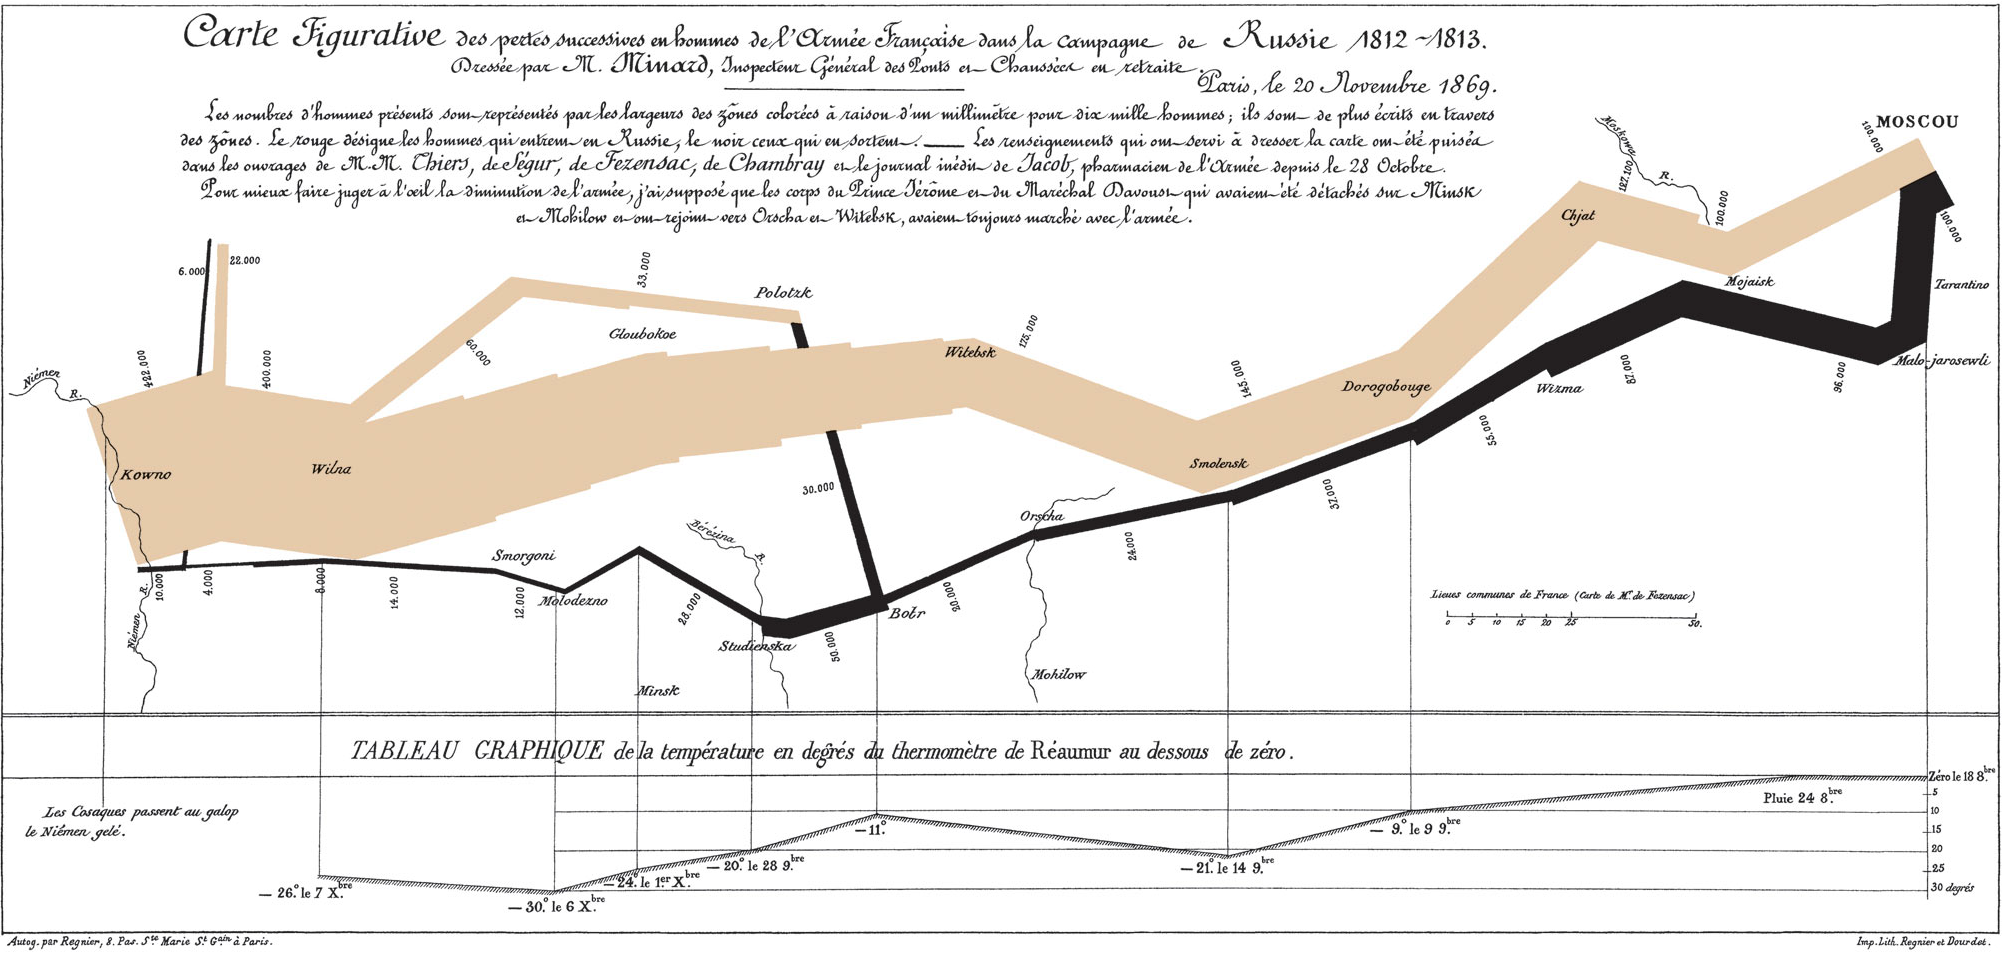
Data visualization is a passion of mine. I remember reading Edward Tufte’s book The Visual Display of Quantitative Information & stumbling across Charles Minard’s “Napoleon’s March.”
Most visualizations plot 2 dimensions. Napoleon’s March encodes 6 : the geography of the terrain, the route & the direction of the army, the headcount of the troops, the temperature of the battlefield, & the time of year of Napoleon’s doomed quest to conquer Russia. Click to enlarge it.

 My laptop is faster than your cloud.
 On November 29th at 9am Pacific Time, Office Hours will host