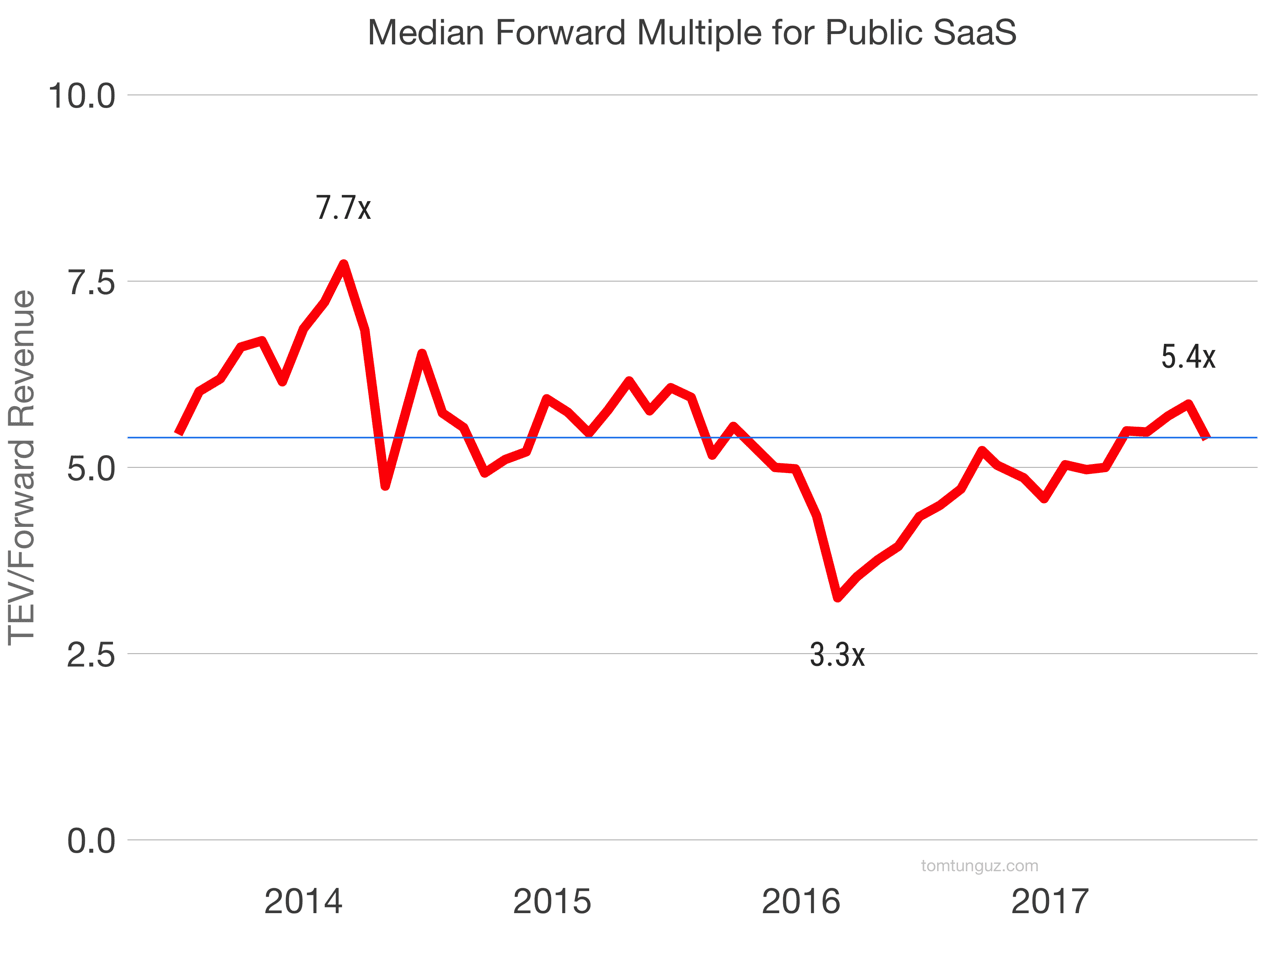
The Price Anchoring Effect of Distribution Platforms

image

When building a SaaS product for salespeople, a startup’s price will inevitably be compared to Salesforce CRM’s cost of about $150 per seat. How expensive is this new product compared to Salesforce? In diligence calls, I often hear buyers say: one-half of Salesforce’s price seems expensive; one-third might seem more reasonable. This is the price anchoring effect in the real world.

This is true beyond sales products. For example, a basic server on Amazon costs about $600 per year. Server monitoring companies cost about roughly 30-50%.

Read more

The Challenge of Performance Pricing for SaaS Companies

A founder emailed me last week to raise the question of whether performance pricing for SaaS companies is an effective technique. Performance pricing means explicitly pricing of product in terms of the customers’ revenue gained or cost reduced from its use.

Conceptually, performance pricing is very rational. The buyer should be willing to pay between 10 to 15% of the revenue or cost savings for the use of the product. And as classical economics instructs us, this type of pricing mechanism optimally aligns the incentives of the buyer and the seller. But the reality is more nuanced.

Read more

The Bustling IPO Market of 2017

image

Five months into 2017 nine venture-backed technology companies have gone public compared to 14 in 2016. Four consumer companies and five enterprise companies have popped on average 29% since their IPO pricing. Only two, Carvana, an online used car dealer, and Netshoes, a Brazilian ecommerce company have traded down from their IPO pricing. The other seven have demonstrated the broad public investor demand for new offerings.

image

B2B companies’ market cap totals $9.8B which is a third of B2C at $27B. Of course, Snap accounts for $26B of the $27B, or 96% of the consumer market cap. This bar chart characterizes a truism that differentiates consumer companies. There are fewer consumer companies of scale, but when they succeed, they can be monstruously large, and grow much faster than B2B companies. Snap is the youngest company of the cohort, founded in 2011.

Read more

When Statistics Will Mislead You

image

Earlier this week, a founder asked whether the fundraising market suffered from seasonality. Are there more prosperous months to raise than others? That’s a simple question to answer - or so I thought. Ultimately, a dinosaur proved to me the answer is more nuanced.

I plotted the mean round size of Series As from 2010-2016 in the bar chart above. You’ll notice, as I did, a spike in June and November. And a t-test shows these differences are statistically significant. The p-values for Jan/June and Jan/November are 0.002 and 0.0008. A very compelling figure to argue the difference in means is real. What logic might explain these surges?

Read more

A Spike of Venture Debt in Startups

image

Instead of raising an equity round, a startup might choose to borrow money - and for good reason. Venture debt dilutes founders much less than equity rounds. Low interest rates have increased the attractiveness of venture debt, because the cost to borrow is low. Venture debt is an attractive financial product. No wonder it has grown in popularity by 16x in the in the last six years.

The chart above shows the amount of venture debt borrowed by US technology startups. Venture debt volumes have surpassed Series A and Series B dollars. I’ve also included equity crowdfunding, another alternative financing strategy, as a comparison.

Read more

My Algorithm is Better than Yours

My algorithm is better than yours. My algorithm performs better on the precision/recall tradeoffs. It surfaces fewer false positives. It converges to an answer faster. Perhaps it requires a bit less data. Those statements might all be true. But none of these advantages confer a competitive sales advantage in the market. They aren’t technology innovations leading to a go-to-market advantage.

I first observed the use of large scale machine learning at Google. In the early and mid-aughts, the advertising ecosystem bloomed. Hundreds of ad networks vied for publisher ad impressions. Each one promised a better targeting system, new algorithms, unique data, better performance, more revenue.

Read more

A Tale of Two Go To Market Strategies

There are approximately 22 million trucks in the US. Many of these trucks run software to track the location of the vehicle, manage inventory, and comply with regulation. There are two SaaS companies operating at greater than $100M in ARR in the space and they illustrate one of the mantras on this blog: there are many different ways to build a SaaS company.

After last week’s post, Is There a No Man’s Land in SaaS ACVs, a founder asked me to highlight some of the go to market strategies in different segments. The story behind Fleetmatics and Geotab illustrates the way two companies pursued the SMB logistics market in radically different ways, but built roughly similar sized businesses.

Read more

Is There a No Man's Land in SaaS ACVs?

A founder asked me recently if a dead zone in ACVs (average contract value) exist around the $10k price point. Yesterday, I listened to a podcast in which an executive asserted that infrastructure software priced lower than $250k in ACV threatens the viability of the company. What does the data show?

image

I’ve plotted the distribution of ACV at IPO for all public software companies. There are no yawning gaps but a smooth progression from $87 to $780,000. So there are successful companies at every price point.

Read more

When Machine Learning Just Isn't Enough

At SaaStr earlier this year, I spoke about the huge potential of machine learning in SaaS. In that talk, I broke down some of the advances in ML that might be useful for software companies. In the discussion that ensued, I stressed the importance of not letting the technology obfuscate the value proposition of the software. Yes, ML is a huge step forward, but it’s not enough by itself. In fact, it likely isn’t the most challenging part of building a disruptive product.

Read more

The Four Dimensions of a Demand Generation Portfolio

After a startup establishes product market fit, scaling demand generation becomes the the next major challenge. Doubling or tripling ARR each year for several consecutive years is not easy. The best marketers create a demand generation portfolio. There are four axes to measure this portfolio: scale of investment, sophistication, breadth and potential.

At the outset, a startup may rely on a single channel of customer acquisition. But over time, in order to achieve larger and larger bookings, the company must diversify. Diversification prevents channel saturation risk. As spend in one channel grows, the cost of customer acquisition rises to untenable rates. Diversification also mitigates channel concentration risk. A change in terms of service of a dominant distribution platform might challenge the business’ existence.

Read more