4 minute read / Aug 2, 2013 /
The 3 Different Strategies of Venture Funds
As I wrote about in a post on aligning founder and VC incentives, it’s important for entrepreneurs to understand their own ambitions and the ambitions of investors. The most important part of that is understanding the financial motivations and the dynamics of the industry VCs face.
Typically, VCs adopt primarily one of three strategies with a fund [1]:
- Small fund, small ownership positions, many investments in markets that will consistently generate sub-$100M acquisitions.
- Medium fund, sizable ownership positions, a moderate number of investments in markets that will occasionally generate $150M to $800M acquisitions.
- Large fund, moderate ownership positions, a moderate number of investments that will consistently generate $1B+ acquisitions.
I’m going to use CBInsights' 2012 Private Technology Company M&A Data data to demonstrate why VCs adopt these three strategies.
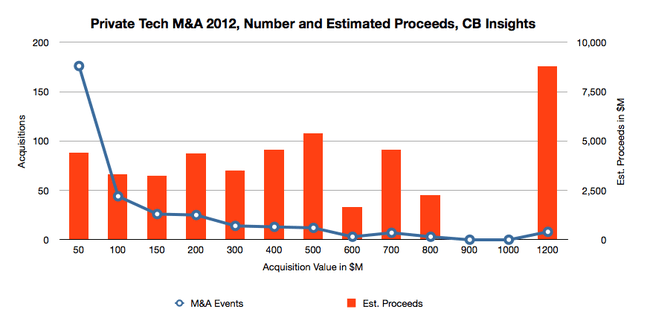
Exit Distribution
Below is the chart showing the number of private technology company acquisitions of various sizes ranging from $0 to $1.2B. As you might expect, 53% of acquisitions by number are sub-$50M and the $1B+ transactions generate 19% of the proceeds.
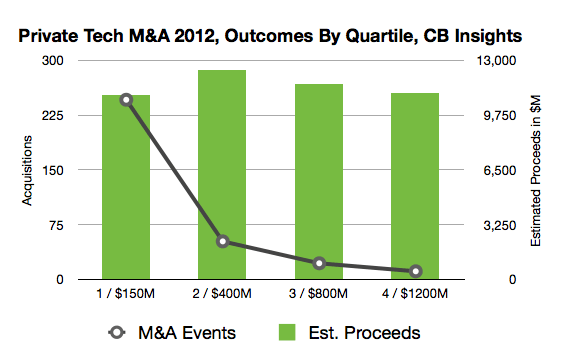
Another Perspective on the Data: Quartiles
But let’s look at the estimated proceeds in another way, by quartile. Each of the four outcome buckets below generated the same amount of return to investors[5], about $11B in 2012. Obviously, the left-most bucket requires many more acquisitions than the right-most bucket to achieve the same result, but there are twenty-one times fewer $1B exits than sub-$50M exits so the odds of investing in those billion dollar winners are much slimmer. Pick your poison.
Matching a Fund to a Quartile
Given it is possible to generate the same gross returns in each quartile, it is theoretically possible to construct four different portfolios with four different strategies and each generate the same returns. Let’s look at those portfolios:
| Fund | Small Fund | Early Fund | Blended Fund | Growth Fund |
| Target Quartile | 1 / $150M | 2 / $400M | 3 / $800M | 4 / $1200M |
| Avg 2012 Exit[4] | 45 | 239 | 527 | 1005 |
| Fund Size | 75 | 250 | 400 | 1000 |
| Avg Investment | 1 | 5 | 10 | 25 |
| Investments | 75 | 50 | 40 | 40 |
| Target Return | 3 | 3 | 3 | 3 |
| Ownership | 10% | 25% | 20% | 15% |
| M&A/IPO Ratio [2] | 70% | 70% | 70% | 70% |
| Gross Proceeds to Achieve Multiple | 225 | 750 | 1200 | 3000 |
| M&A Market Cap Required | 1575 | 2100 | 4200 | 14000 |
| Number of Exits Required | 35 | 9 | 8 | 14 |
| Investment Success Rate Required | 47% | 18% | 20% | 35% |
Assuming each fund pursues a pure strategy of targeting exits within their quartile [1], the small fund will make 75 investments of which 47% must be sold at an average of $45M. The Early Fund must invest in 50 companies and sell 9 of those for $250M each. The Blended Fund must invest in 40 companies and sell 8 for $527M each and the Growth Fund must invest in 40 companies and sell 14 at $1B each. Each of these hypothetical funds would generate a 3x for their investors.
In summary, small funds tend to make many bets and aim for high success rates. Medium funds are able to accept close to half of the failure rate of a pure strategy small fund while the hypothetical growth fund takes a smaller amount of risk.
The Relationship Between Risk and Ownership Targets
Not coincidentally, the ownership percentages typical are inversely proportional to risk tolerance. The greater the acceptable failure rate, the more important ownership becomes, because the winners must cover a fund’s losses.
There are many different ways of constructing a fund’s strategy and those strategies vary with the risk tolerances of the individuals raising the fund, innovation cycles and financial market cycles. But at the core of the venture business are these three fundamental investment strategies.
Notes
The data I use here are all estimates because I don’t have access to CBInsights source data.
I removed the Facebook IPO from calculations because of its disproportionate and skewing effect on the data.
[1] VCs often blend these strategies in portfolio construction. Every investor aspires to a $1B+ exit. But, to simplify the analysis, I’m assuming funds pursue only a single strategy. And of course no investor has perfect knowledge of the ultimate acquisition price of a business, but instead uses market size, public company multiples and other data to form a proxied estimate for that value.
[2] NVCA data excluding FB IPO; rough average for last 3 years
[3] CBInsights Data
[4] My calculations based on estimates of CBInsights Data
[5] Gross returns will be the same, but cash on cash investment multiples will vary.