Let’s compare the organizational design of two hypothetical startups. Each has 4 layers in the company: CEO, VP/Director, Manager & Individual Contributor (IC).
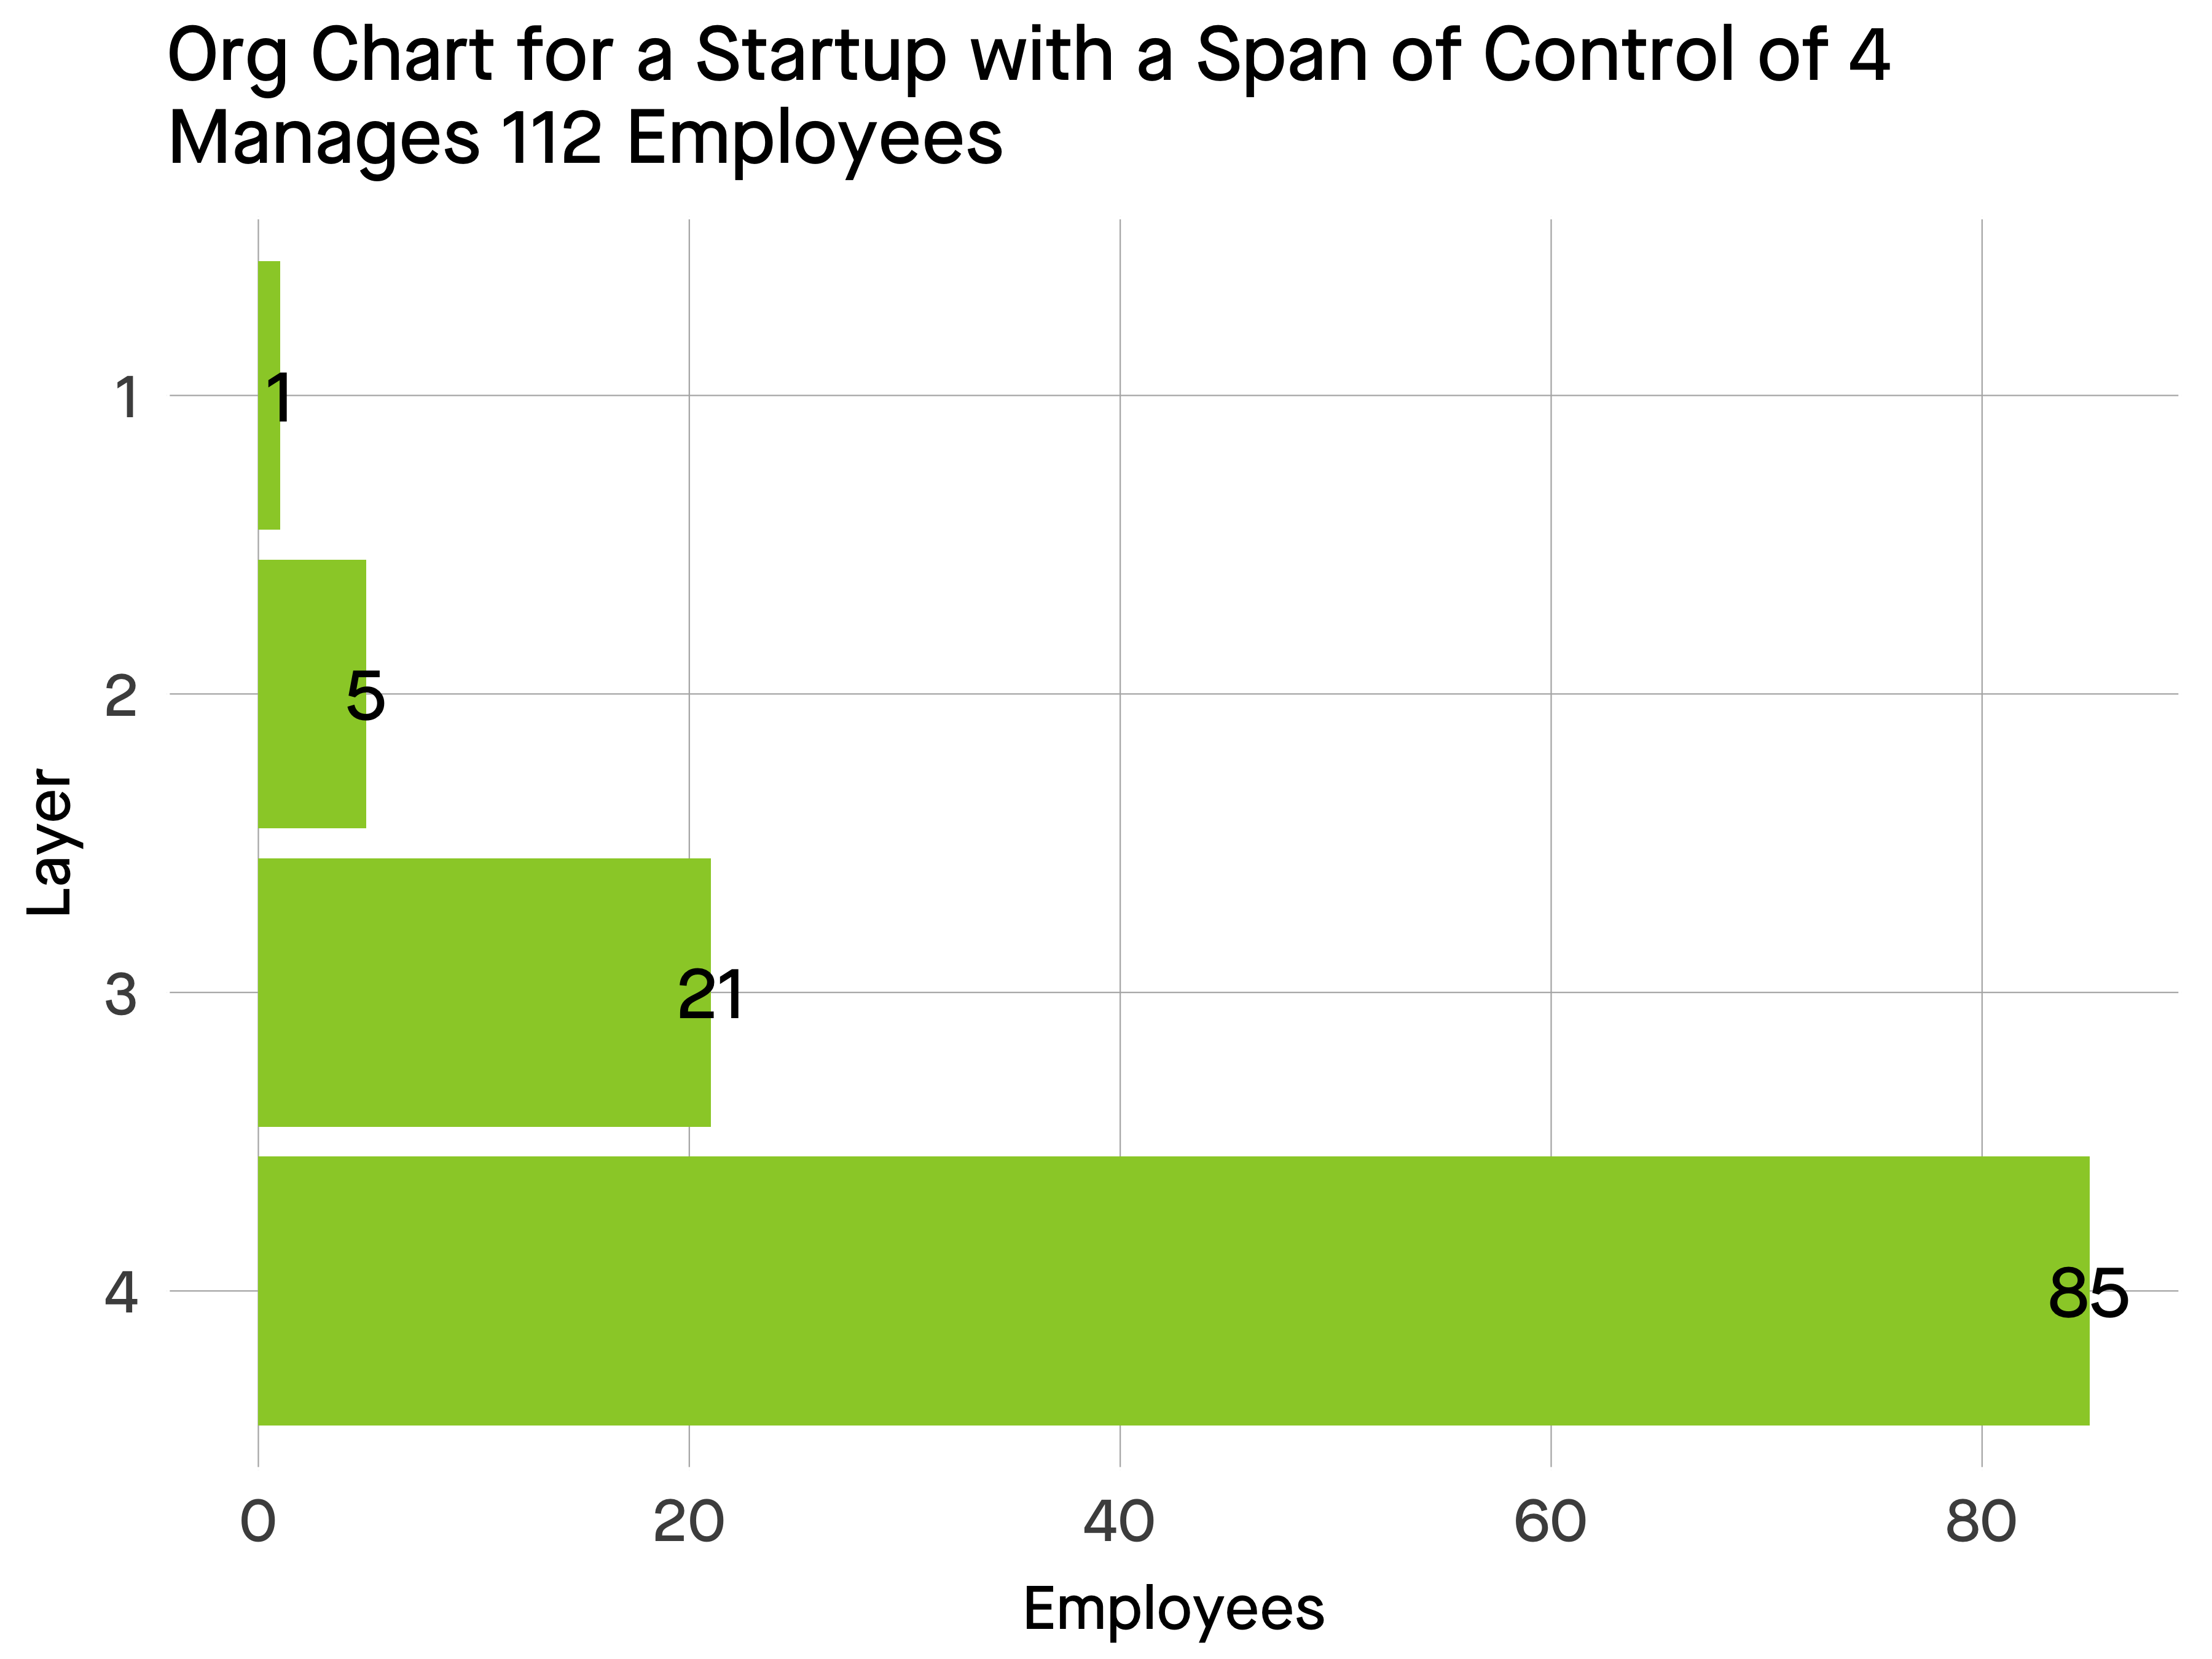
This first company has 112 employees across those four levels. 27 in management & 85 doers. Each manager has four reports. This is called the span of control. Layer 1 is the CEO, 2 are the VPs, etc.

The second company - again with 4 levels - has 466 employees with 66 in management & 400 doers.
These visualizations illustrate the idea that better managers enable more efficient organizations. Companies who ignore span of control grow soft in the middle. More personnel expense in management with less output which is a lose/lose proposition.
A man walks down the street, He says, Why am I soft in the middle now? Why am I soft in the middle? The rest of my life is so hard!
Increasing span of control from 3 to 8 means 88% of the employee population are individual contributors doing work rather than 69% - an increase of 28%.
| Span of Control | % ICs of Total Employee Population |
|---|---|
| 2 | 57% |
| 3 | 69% |
| 4 | 75% |
| 5 | 80% |
| 6 | 83% |
| 7 | 86% |
| 8 | 88% |
Temporary decreases in span of control tend to occur in high growth companies when managers hire teams in short order. But looking at span of control over time sheds light on team structure.
As the market encourages startups to push for greater efficiency, management teams may want to examine the shape of their org structure.