3 minute read / Jun 9, 2014 /
The Impact of VCs in Seed Rounds in Seven Charts

For the past several years, early stage VCs have entered the seed market with vigor. VC’s entry has resulted five different important trends in the past five years:
- The total dollars entering the seed market has increased by 132%.
- The mean seed round size has increased by 114% to $1.4M.
- VCs’ typical seed investment has grown by 50%.
- Mega-seeds, those seed investments over $2M, have reached historic highs exceeding 80 instances in 2013.
- The mean mega-seed round is $2.26M during the past five years but in 2013 that figure reached $2.8M, which implies mega-seeds have replaced traditional early Series A.
Though total number of seed investments increased by 30% comparing 2013 to 2011, but astoundingly, the total dollars entering the seed ecosystem has increased by 132%.
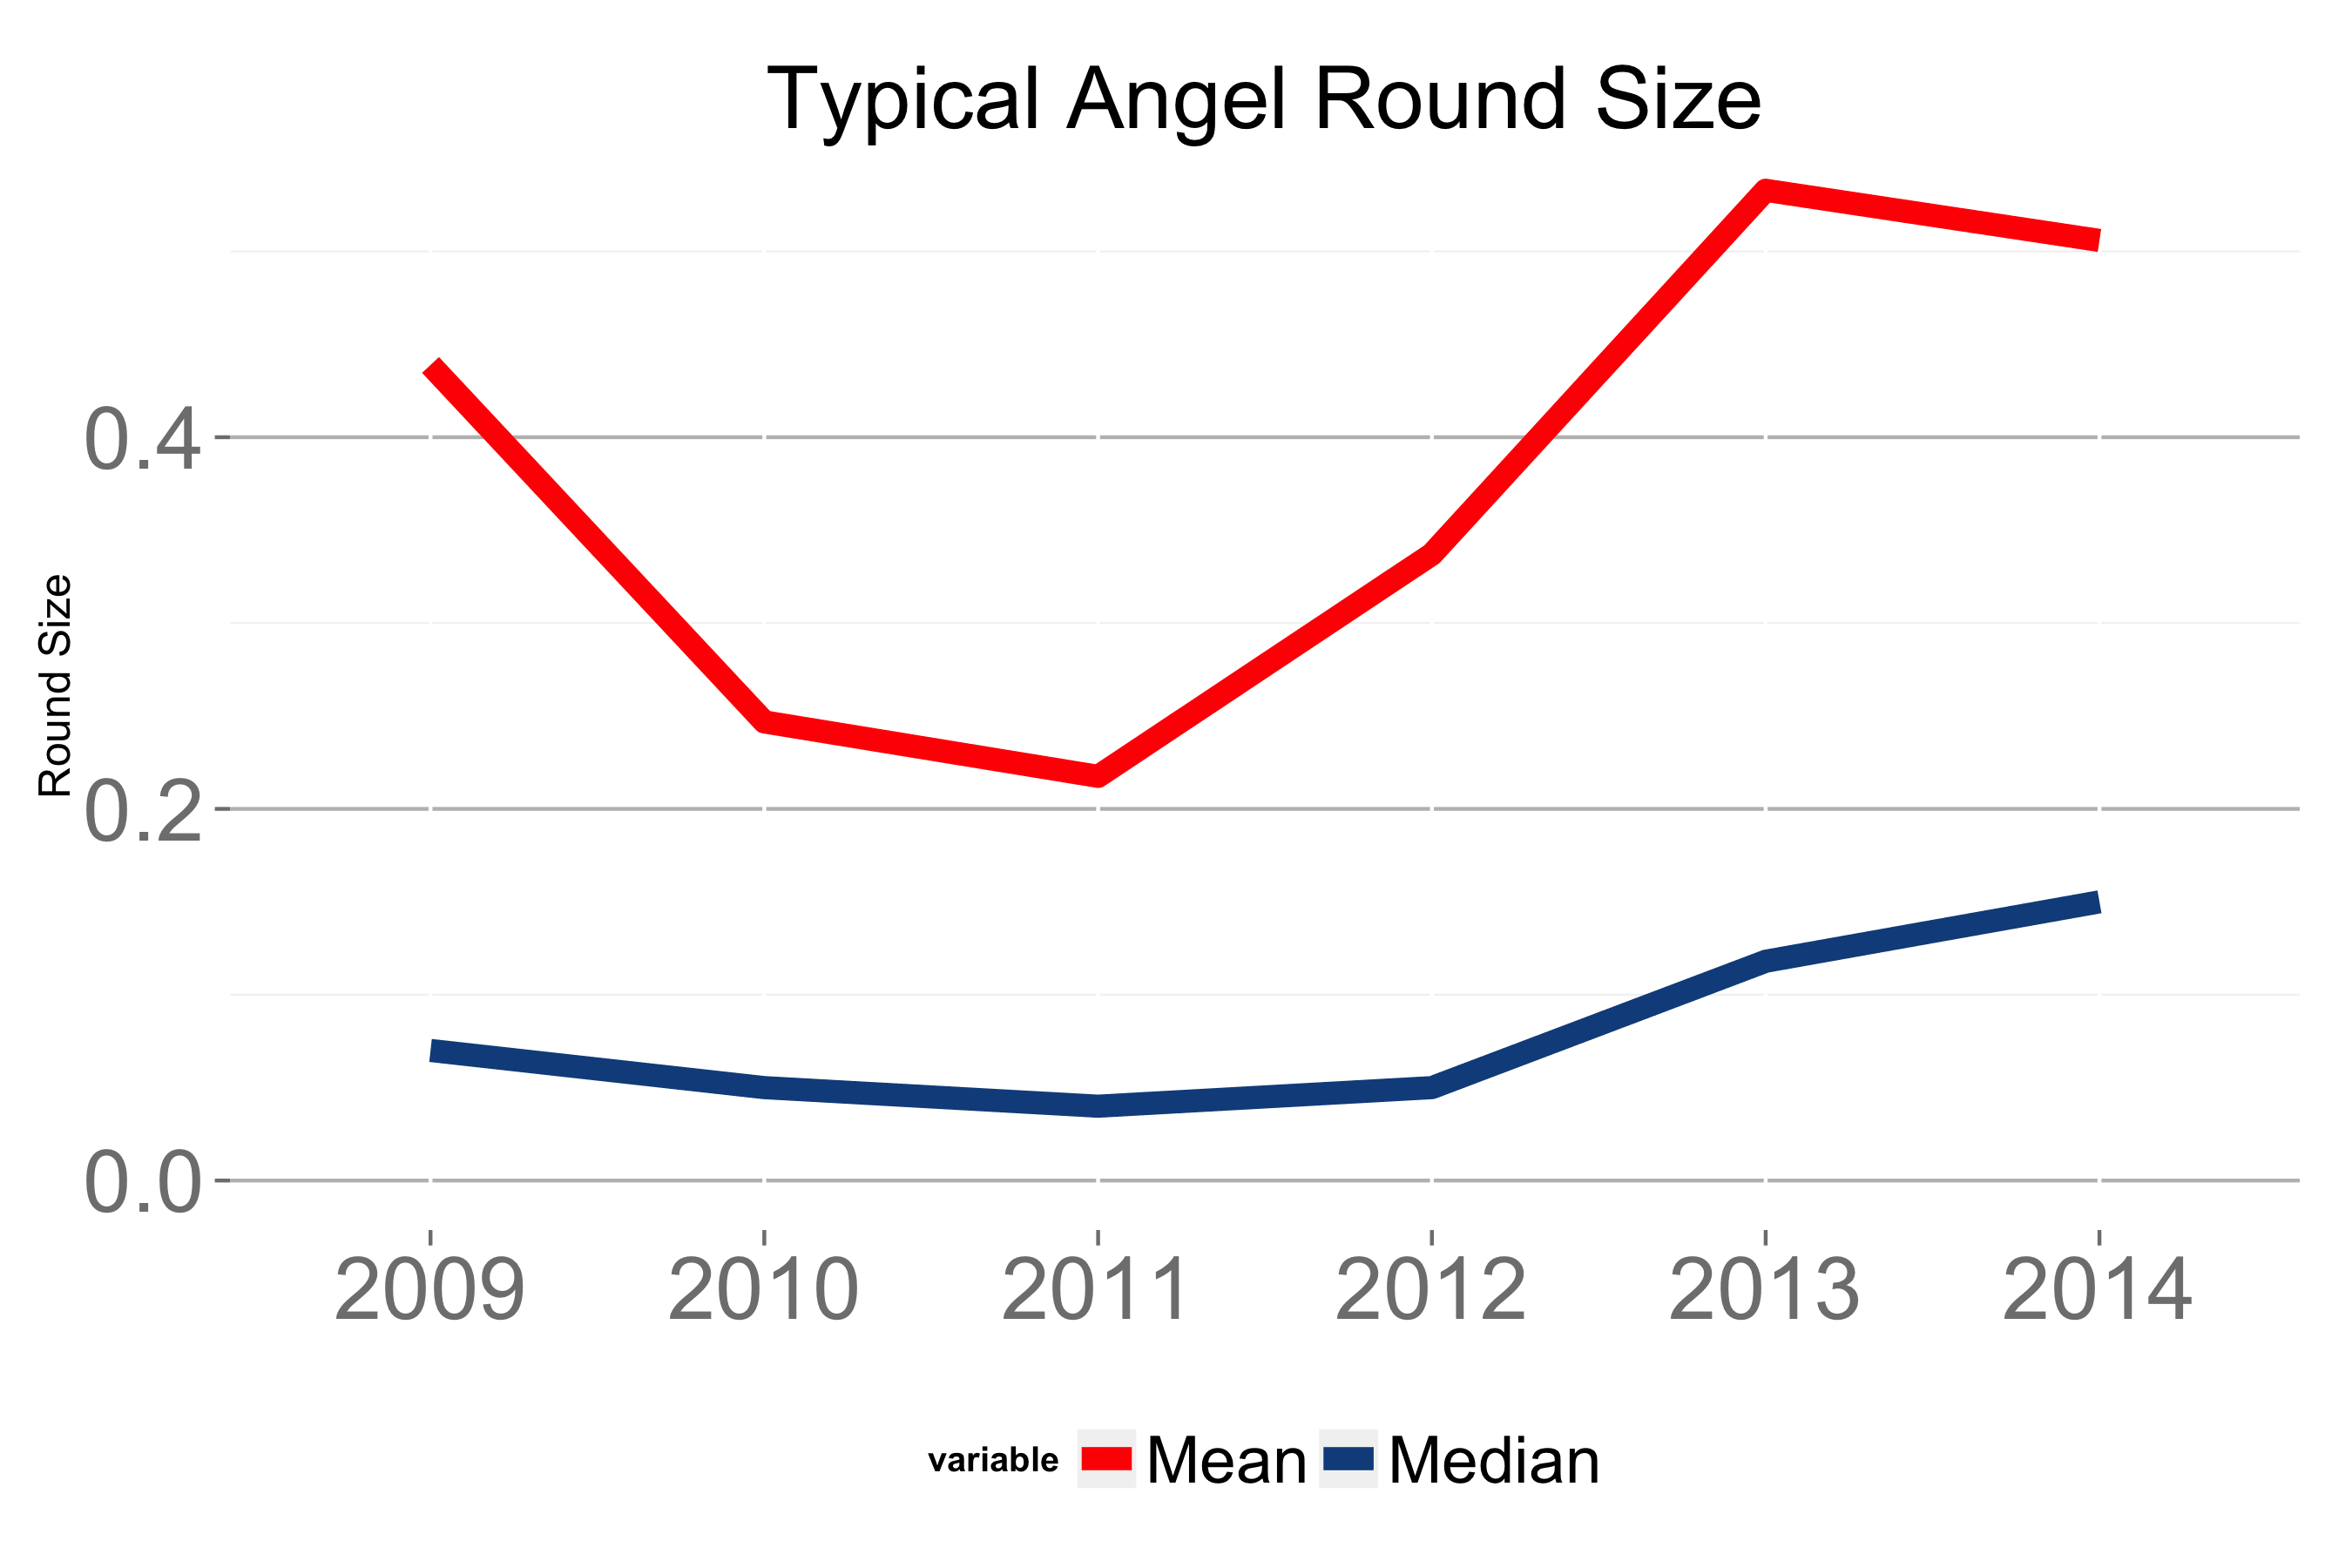
The impact of VCs on the seed market is hard to overstate. I’ve taken Crunchbase data and split the seed financings based on those with venture investors involved and those without. The typical angel round size over the same time period is shown below. Over the past six years, the average round size has varied from about $200k to about $500k most recently. The median rests around $150k.
Let’s compare this with the trends of seed rounds with VCs. Seed rounds with VCs are much bigger and have doubled in size in 5 years from $1M to more than $2M. The growth is statistically significant with greater than 95% confidence for all years. The trend is real.

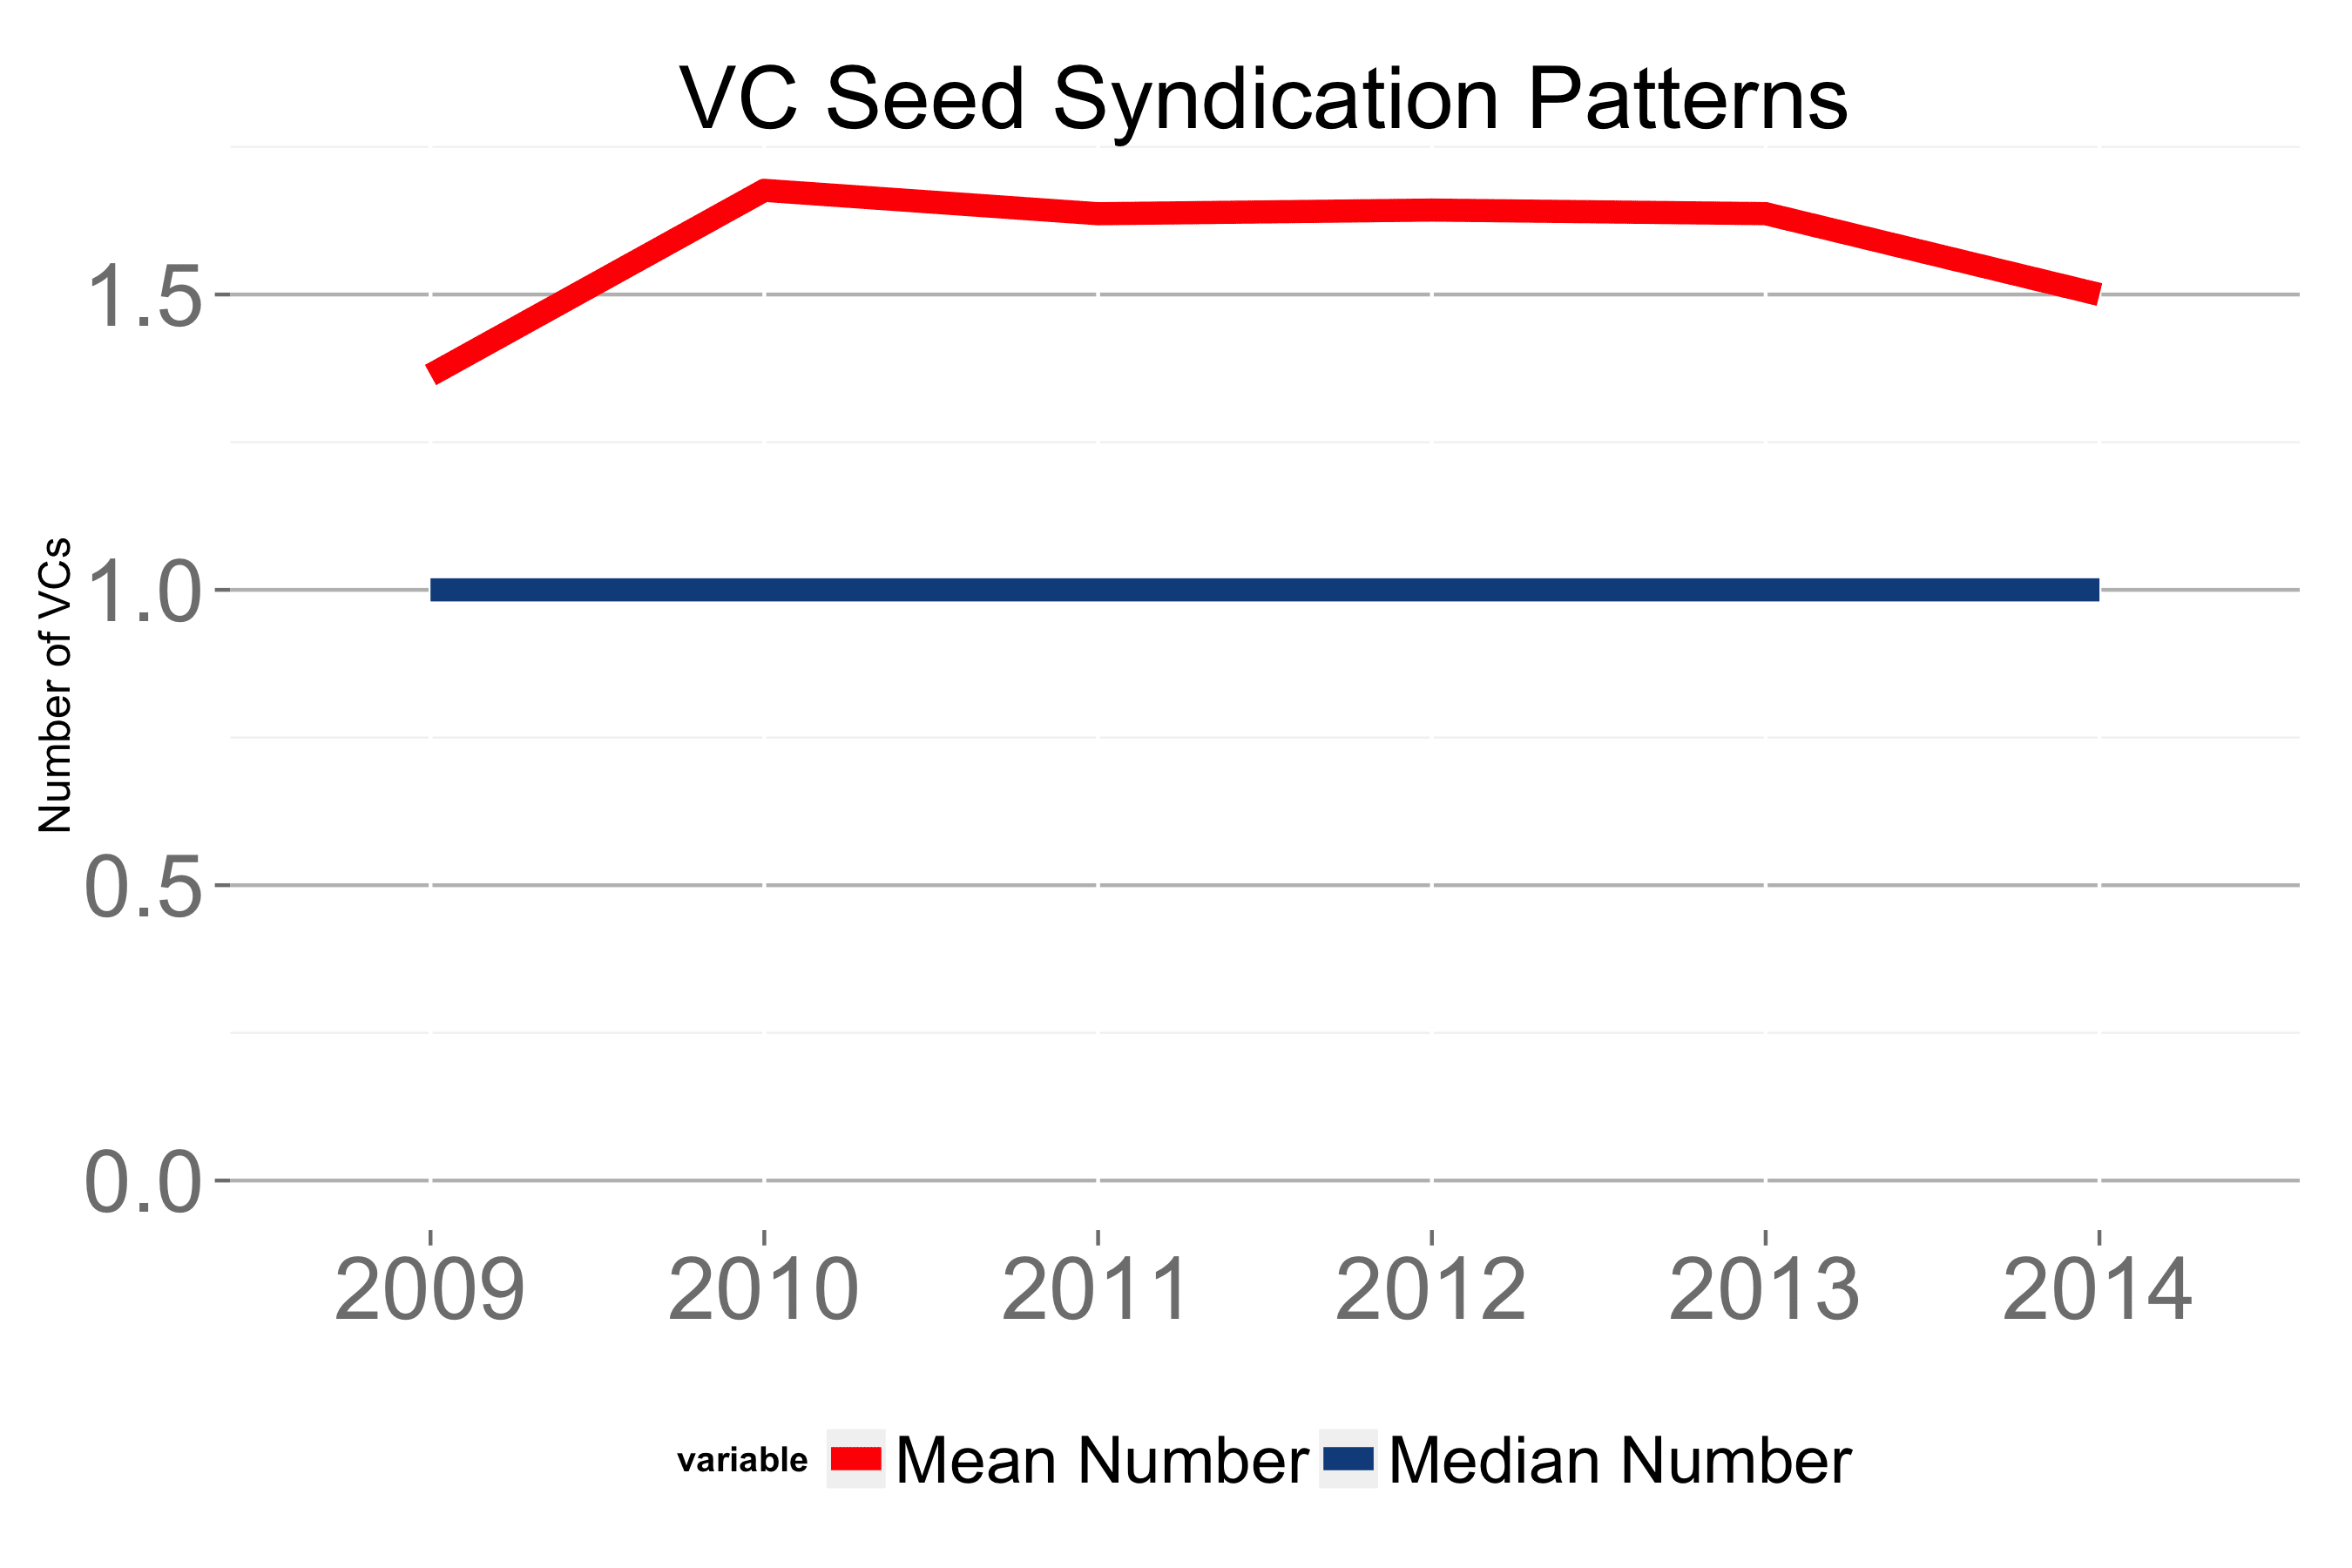
As these round sizes increase, I wondered if VCs are investing more and underwriting larger investments or if VCs are syndicating more. The Crunchbase data indicates the average number of investors in a seed round involved with a VC is about 1.6; the median is 1.6. This data implies VCs are writing larger checks into seed investments.
The next question is whether those larger checks occur throughout the ecosystem or only in certain segments. Let’s evaluate the quartiles of seed rounds over that time. A quartile analysis will tell us whether the trends impact the market as a whole or just certain parts of the market.

The quartile chart above shows that the top of the market, the 100% quartile has reached unbelievable heights, with the most competitive seed rounds, aka MegaSeeds, raising in excess of $5M for the past few years. In these cases, seed rounds are simply highly syndicated series As.
Though it’s hard to see in the chart, every other quartile has increased by more than 50% over the time period. One could argue the top part of the market is pulling the rest of the market up. Additionally, the wave of newer institutional seed funds could be contributing to the increases in round sizes.

The number of MegaSeeds has been steadily increasing from below 10 to more than 80 in about 5 years. And the chart below shows the distribution of MegaSeed round sizes over the time period. The mean mega-seed round is $2.2M over the time period and exceeded $2.75M in 2013.

The seed market five years ago was a much quieter market than it is today. As VCs have entered the market, they have increased the number of seeds and the dollars entering the market dramatically. Over time, the increased competition in the market has steadily increased the size of seeds which has now reached a point that the largest seeds have replaced the traditional early Series A.