This post is part of a continuing series evaluating the S-1s of publicly traded SaaS companies in order to better understand the core business and build a library of benchmarks that might be useful to founders.
Zendesk is a 700 person company that builds customer support software. Zendesk went public earlier this year. It’s a remarkable business primarily because the founders and the team have built an incredibly efficient customer acquisition funnel. It’s important to note that Redpoint is an investor in and shareholder of the company.
In the next seven charts, we’ll explore how Zendesk built their business. We will explore revenue growth, average revenue per customer, sales efficiency, payback periods, net income, gross margin and engineering spending. In these plots, I’ve used Zendesk’s colors as a consistent legend. Zendesk company data is green, median values are black, and other company values are gray. All the data come from Zendesk’s S-1.
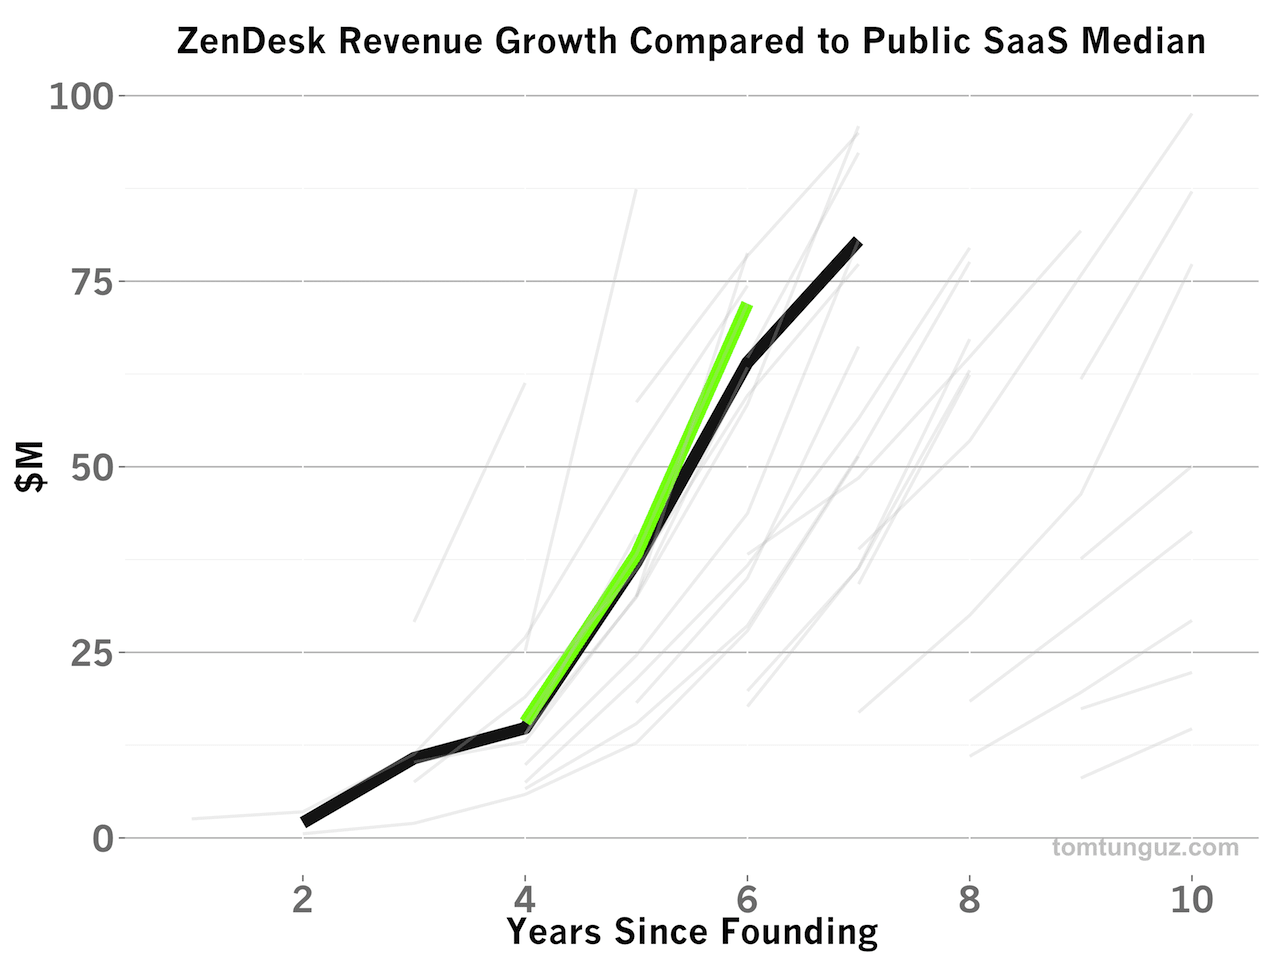
Zendesk has matched the SaaS median for revenue growth each year, and slightly exceeded it in 2013. The company has achieved a 114% CAGR from 2011 through 2013, an impressive growth rate.
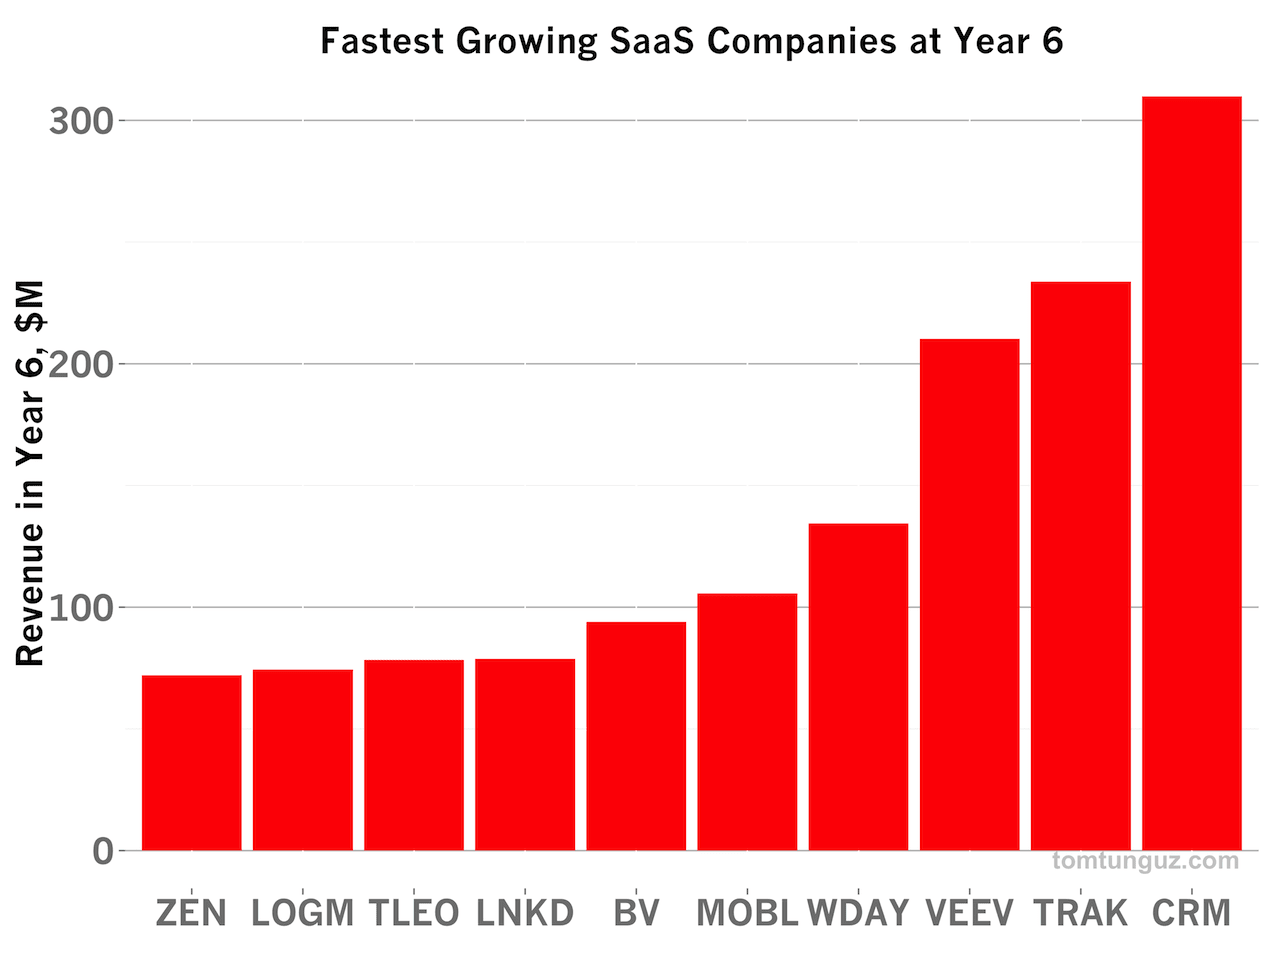
In fact, Zendesk is the 10th fastest growing SaaS company, reaching about $70M of revenue in its sixth year since founding. LOGM, TLEO, LNKD and ZEN achieved the same scale of revenue at the same time, relatively speaking. Setting the standard, Salesforce recorded more than $300M in its sixth year.
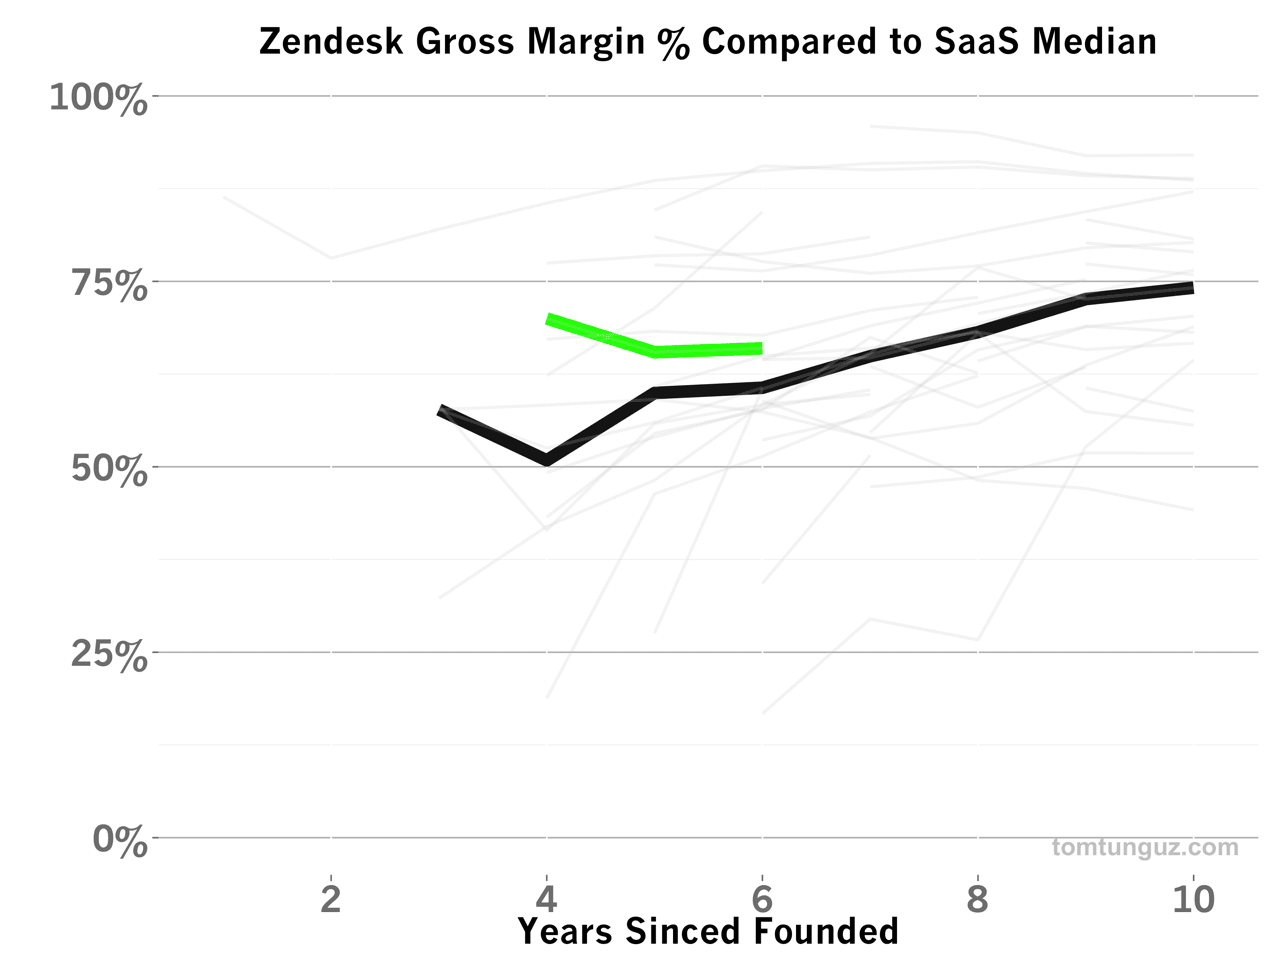
Zendesk’s gross margin which is Revenue minus Cost-of-Revenue (customer support, infrastructure team and expenses, and also the compensation expenses typical at IPO) divided by revenue has exceeded the median for the past few years and is converging to the median of about 70%. This means Zendesk’s costs of providing their service are lower than typical SaaS publics.
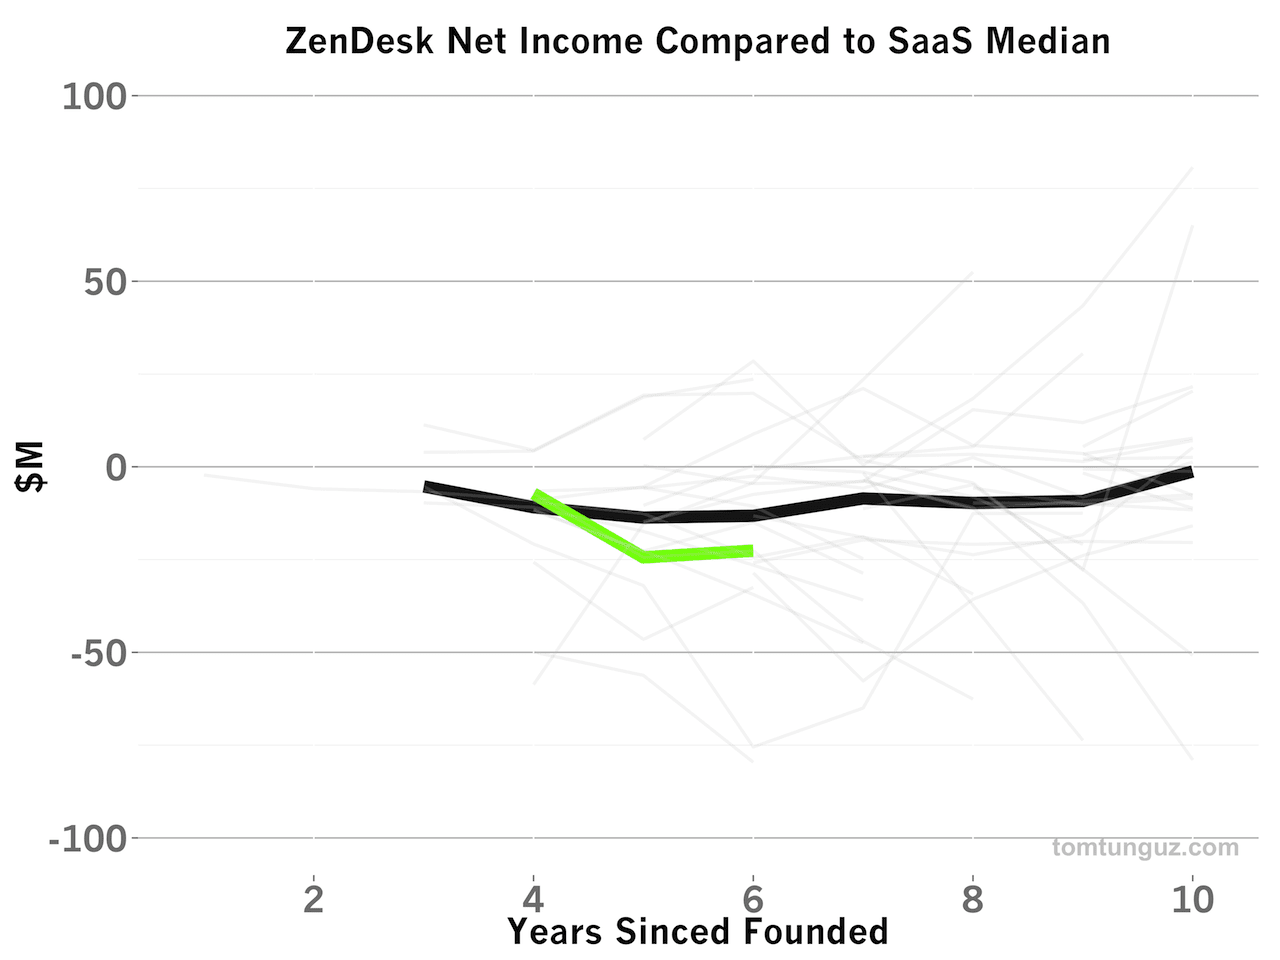
In gross dollar terms, Zendesk burns more cash to grow than the average SaaS company. In the past two years, Zendesk recorded net losses of about $23-24M each year, while the typical SaaS public burns about $13-14M.
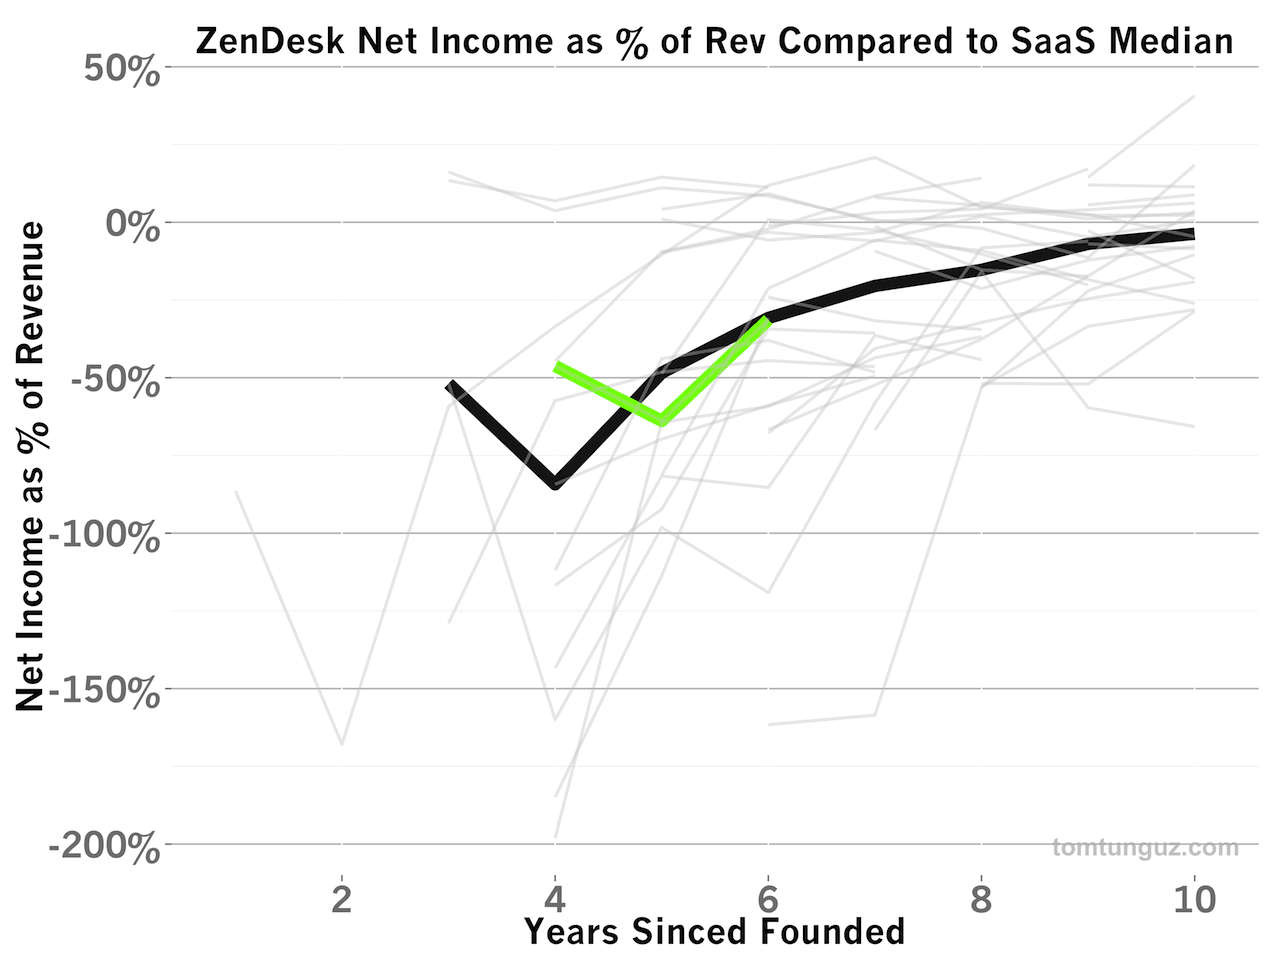
but because zendesk’s revenue has been growing so quickly, the gross net income figure as a fraction of total revenue is identical to the median saas publicly traded company. so, zendesk’s spending is actually in line with other saas publics on a relative basis. this spending is broken into two main categories: r&d and s&m.
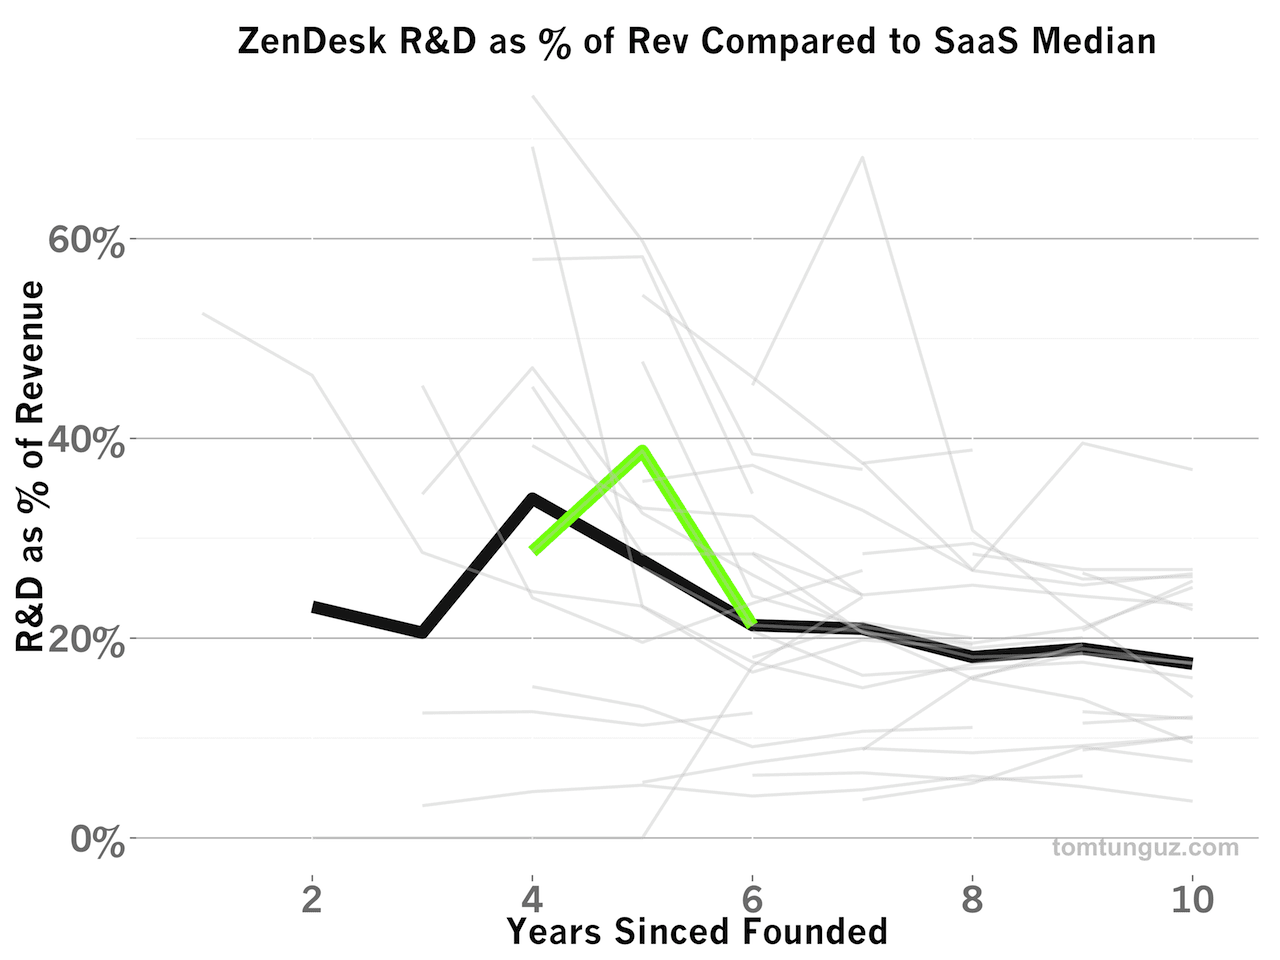
Zendesk has historically spent more than the median on Research and Development (R&D)/Engineering. I suspect part of this might have to do with the vast number of integrations with their customer service suite. By becoming the data repository for customer interactions from email, social media, CRMs, bug tracking and all other types of software both accelerates sales cycles and leverages partners to grow.
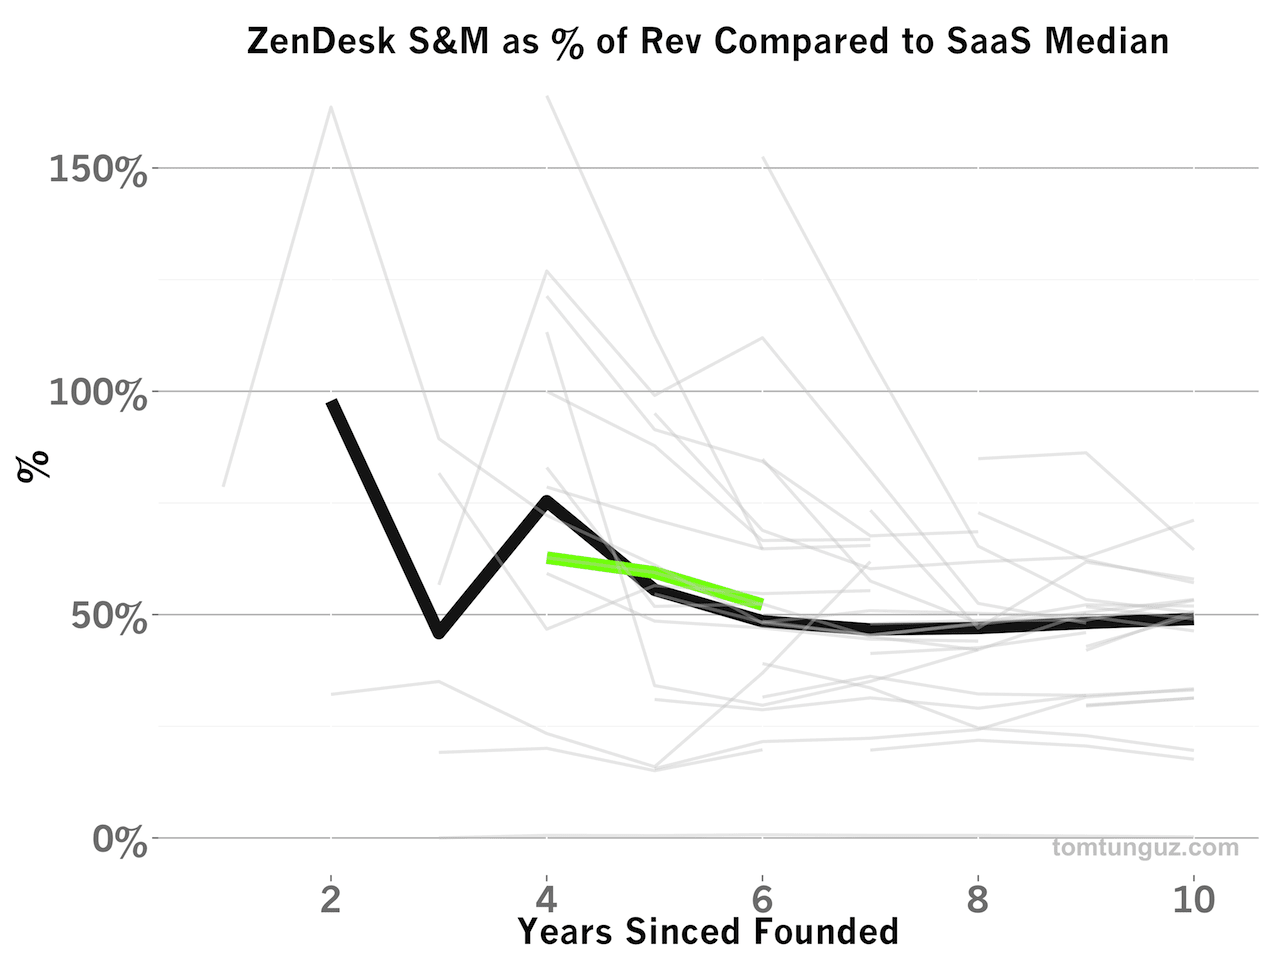
Some might argue that the relatively heavier investment in R&D should reduce the need for Sales & Marketing expense. But that’s not the case here. Zendesk’s S&M outlay as a percentage of revenue matches the median. This means Zendesk spends as much as the typical public SaaS company to acquire new customers.
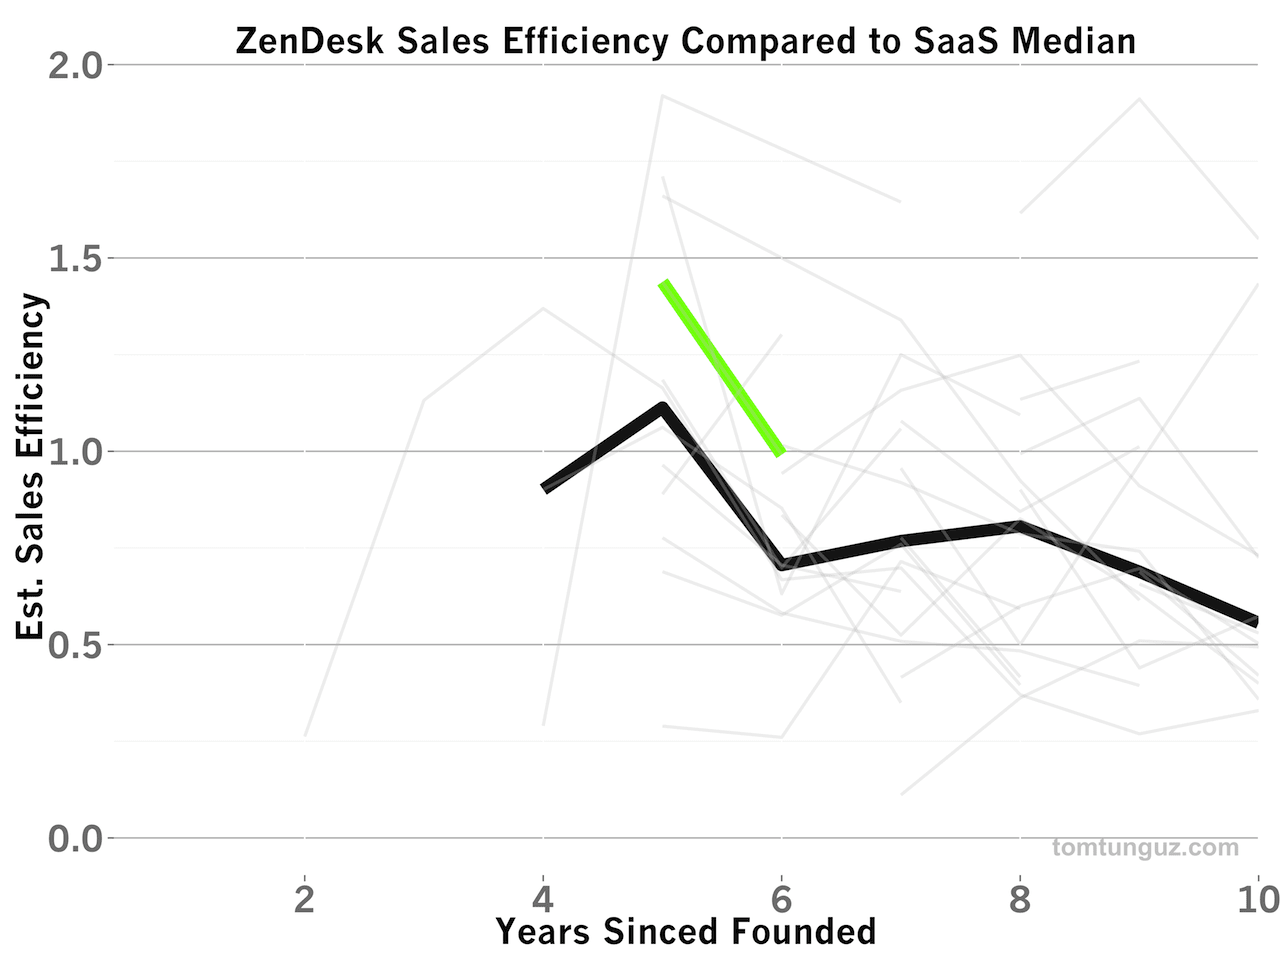
But here’s the kicker: the investments in both R&D and S&M which are substantial enable spectacular sales efficiency. A sales efficiency of 0.8 means a company must spend $1M in Sales and Marketing to generate $0.80 in revenue. In 2012, the company posted a sales efficiency of 1.4 and in 2013, a figure of 1.0, compared to 1.1 and 0.71 for the median.
This means for the same spend as a typical public SaaS company, Zendesk acquires at least 25% more revenue. This sales efficiency is enabled by the combination of a great product, terrific sales and in particular community marketing within the customer support world. Today referrals provide more than 40% of Zendesks’ traffic, about 10 percentage points more than direct visitors - an amazing figure for a B2B product.
| Ticker | Year Since Founding | Gross Profit in $M | Sales Efficiency |
|---|---|---|---|
| VEEV | 5 | 72.5 | 3.3 |
| XERO | 5 | 2.6 | 1.9 |
| WDAY | 5 | 40.5 | 1.7 |
| DWRE | 5 | 5.9 | 1.7 |
| ZEN | 5 | 25.0 | 1.4 |
Putting the sales efficiency figures into context, ZEN is the fifth most efficient SaaS business I’ve measured. Five years since founding, Zendesk recorded a sales efficiency of 1.4. The table above compares the other top SaaS companies by sales efficiency in year five. Veeva is an amazing outlier, a product of a very high average customer value and very few customers. Notably, DemandWare and Xero achieved the number on far smaller gross profit figures. Any way you measure it, Zendesk is one of the most efficient SaaS businesses yet.
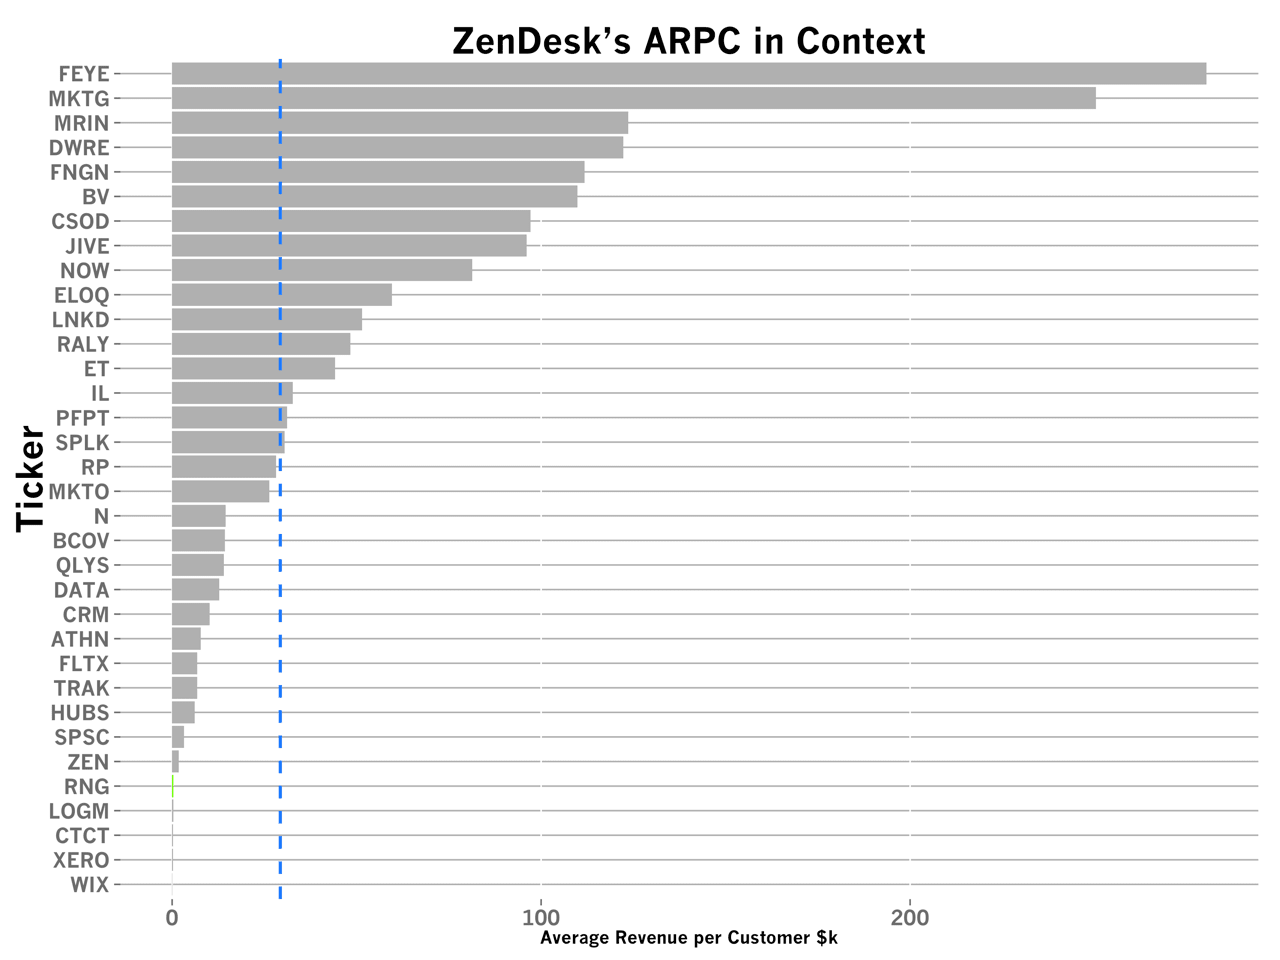
Amazingly, Zendesk is able to achieve this efficiency with one of the smallest average revenue per customer figures in the market, of about $1800 across 40,000 customers when they filed their S-1. Like HubSpot, Zendesk has been able to create efficient customer acquisition channels to amass a huge customer base upon which they’ve built a terrific business.