How much further can the market decline?
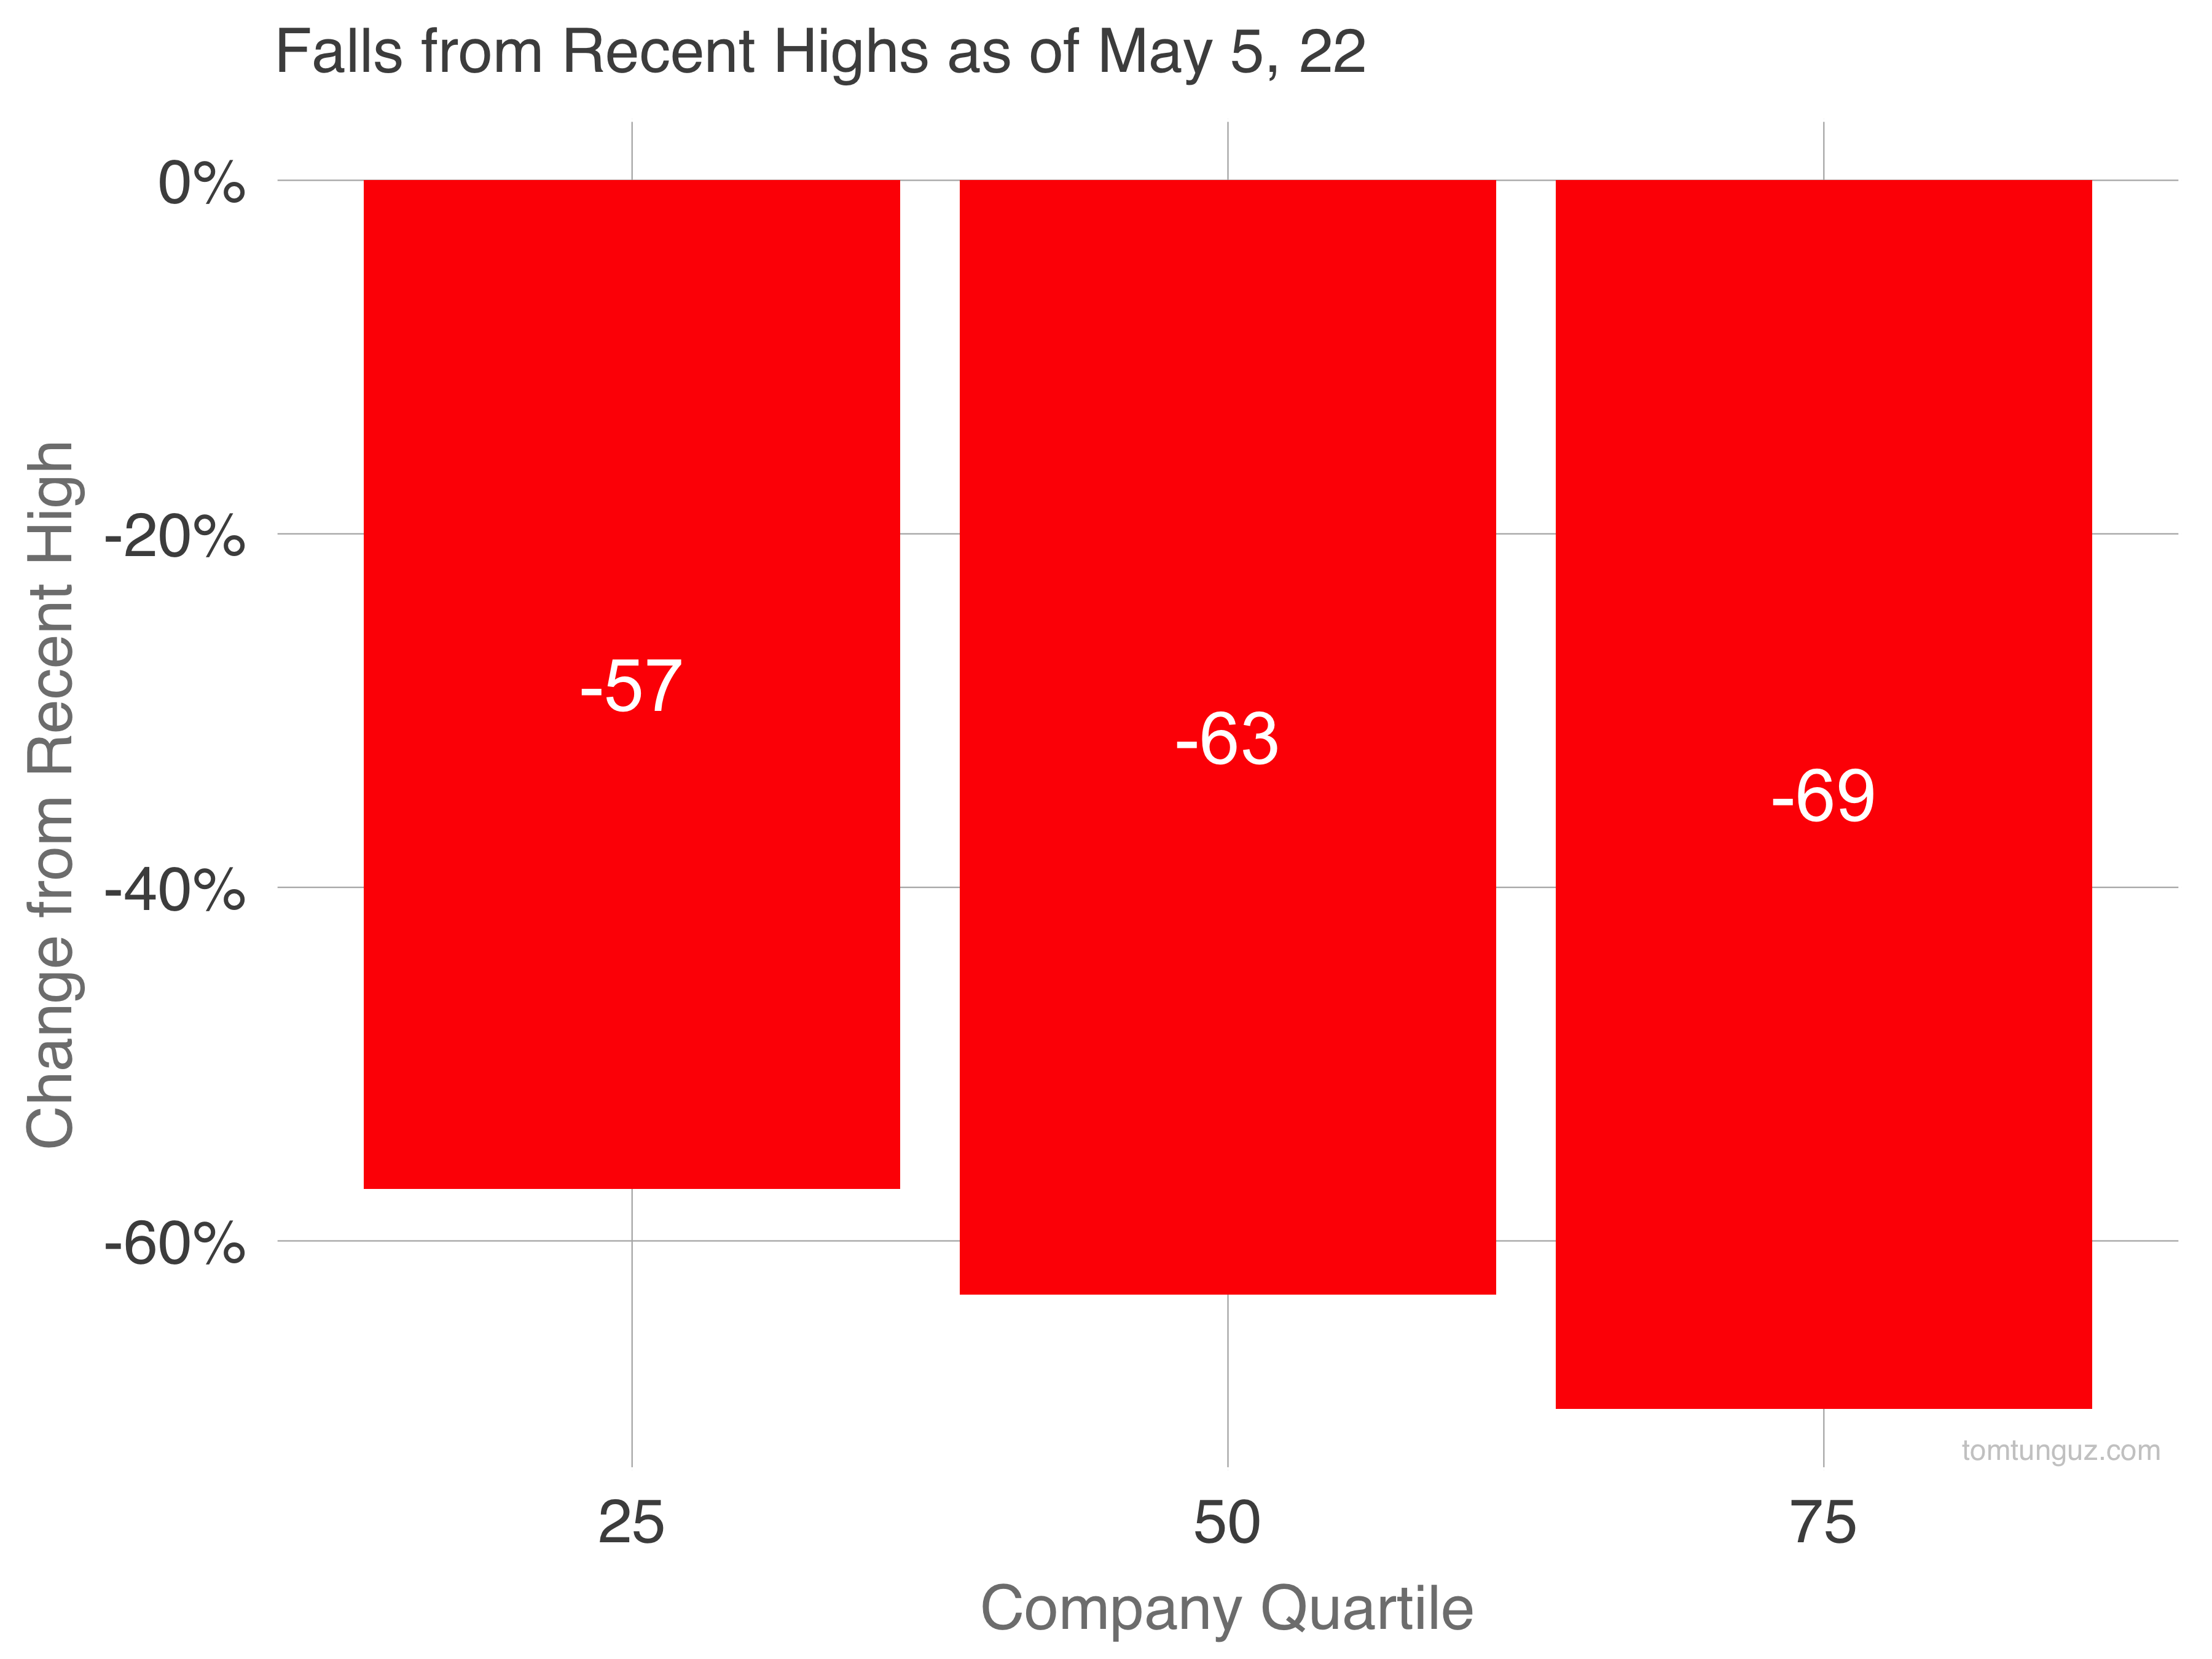
The answer is quite a bit more. That may be hard to believe given the falls from recent highs in software companies approach 70% collapses.
I went through my archives and found this post from 2017 that showed that the most expensive stock at the time was Veeva at 11.7x forward.
Today, CloudFlare tops the list at 22.2x. If the valuation environment mirrors 2017, CloudFlare’s multiple would halve again.
In 2017, the average company traded at 5.4x forward compared to 7.93x as of this morning. There’s precedent for another halving.
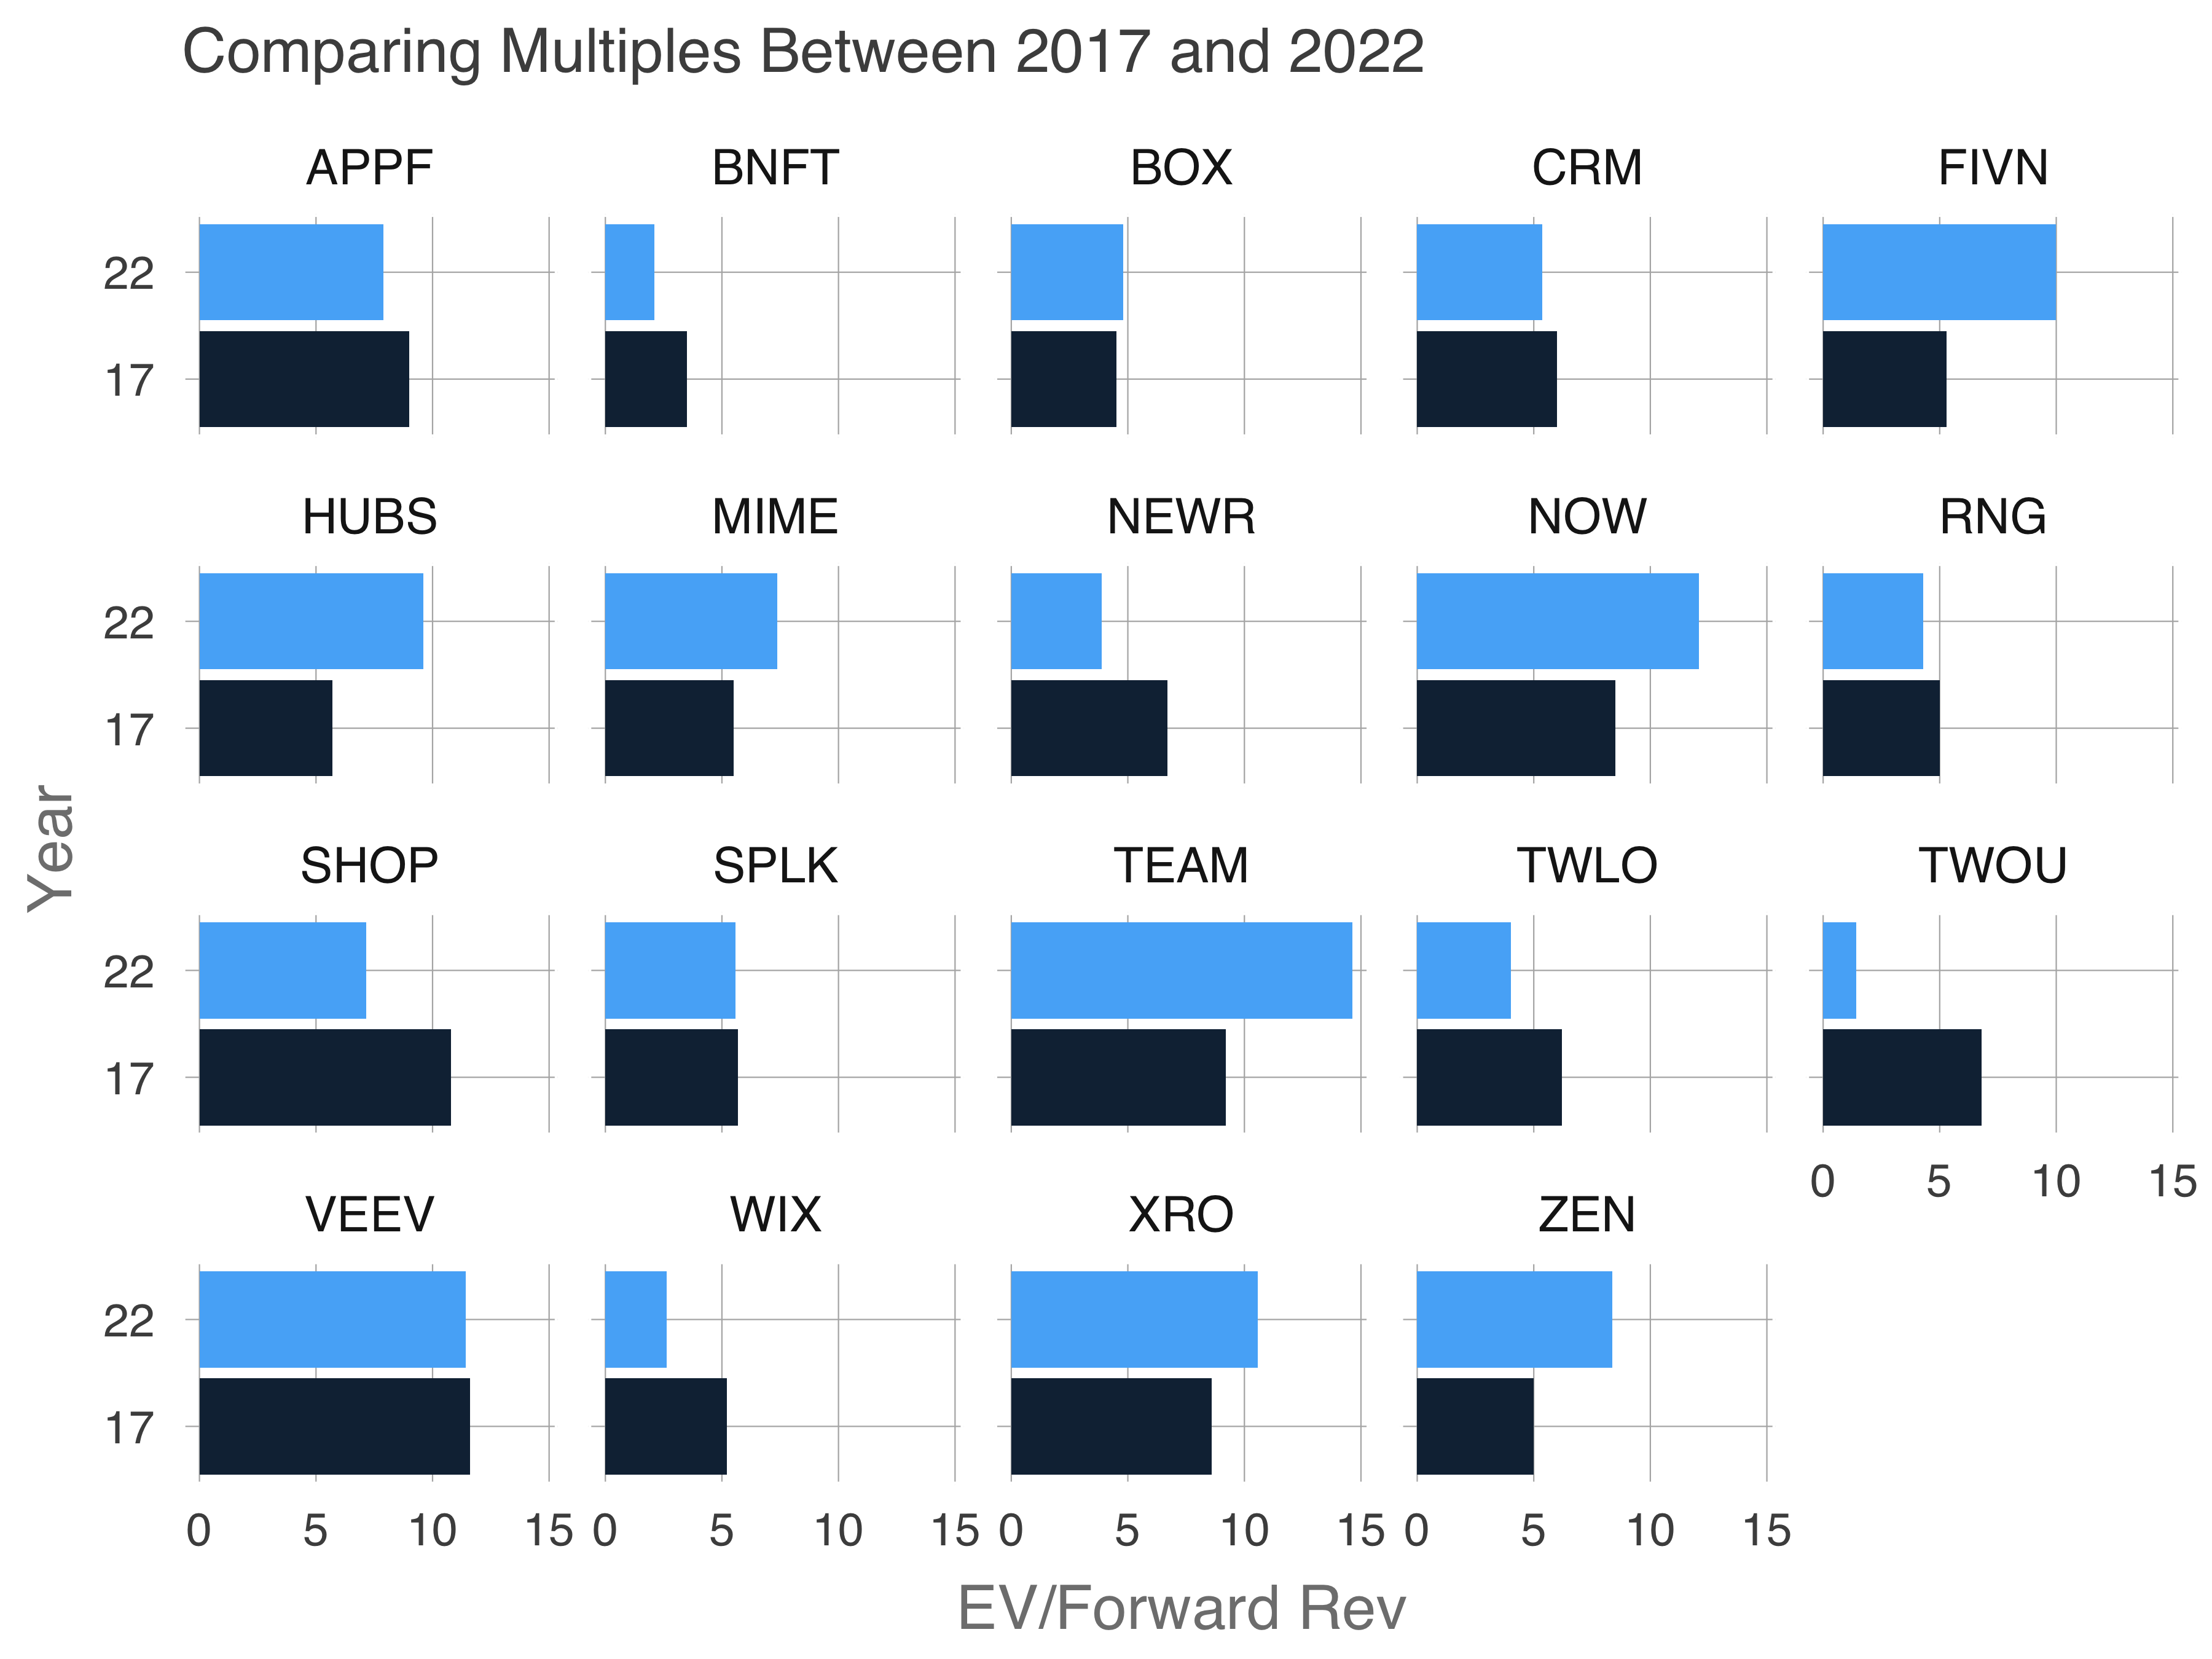
Let’s look at that basket of 2017 stocks and compare their multiples in 2017 and 2022. ServiceNow (NOW) and Five9 (FIVN) have risen. New Relic (NEWR), Wix (WIX) and 2U (TWOU) are lower. Overall, this basket of stocks is at the same multiple as in 2017 (-2% delta).
Why is the overall multiple higher? The high flyers have elevated the distribution at the upper end of the market. If multiples compress further, the top quartile, the fastest growers, will bear the brunt.
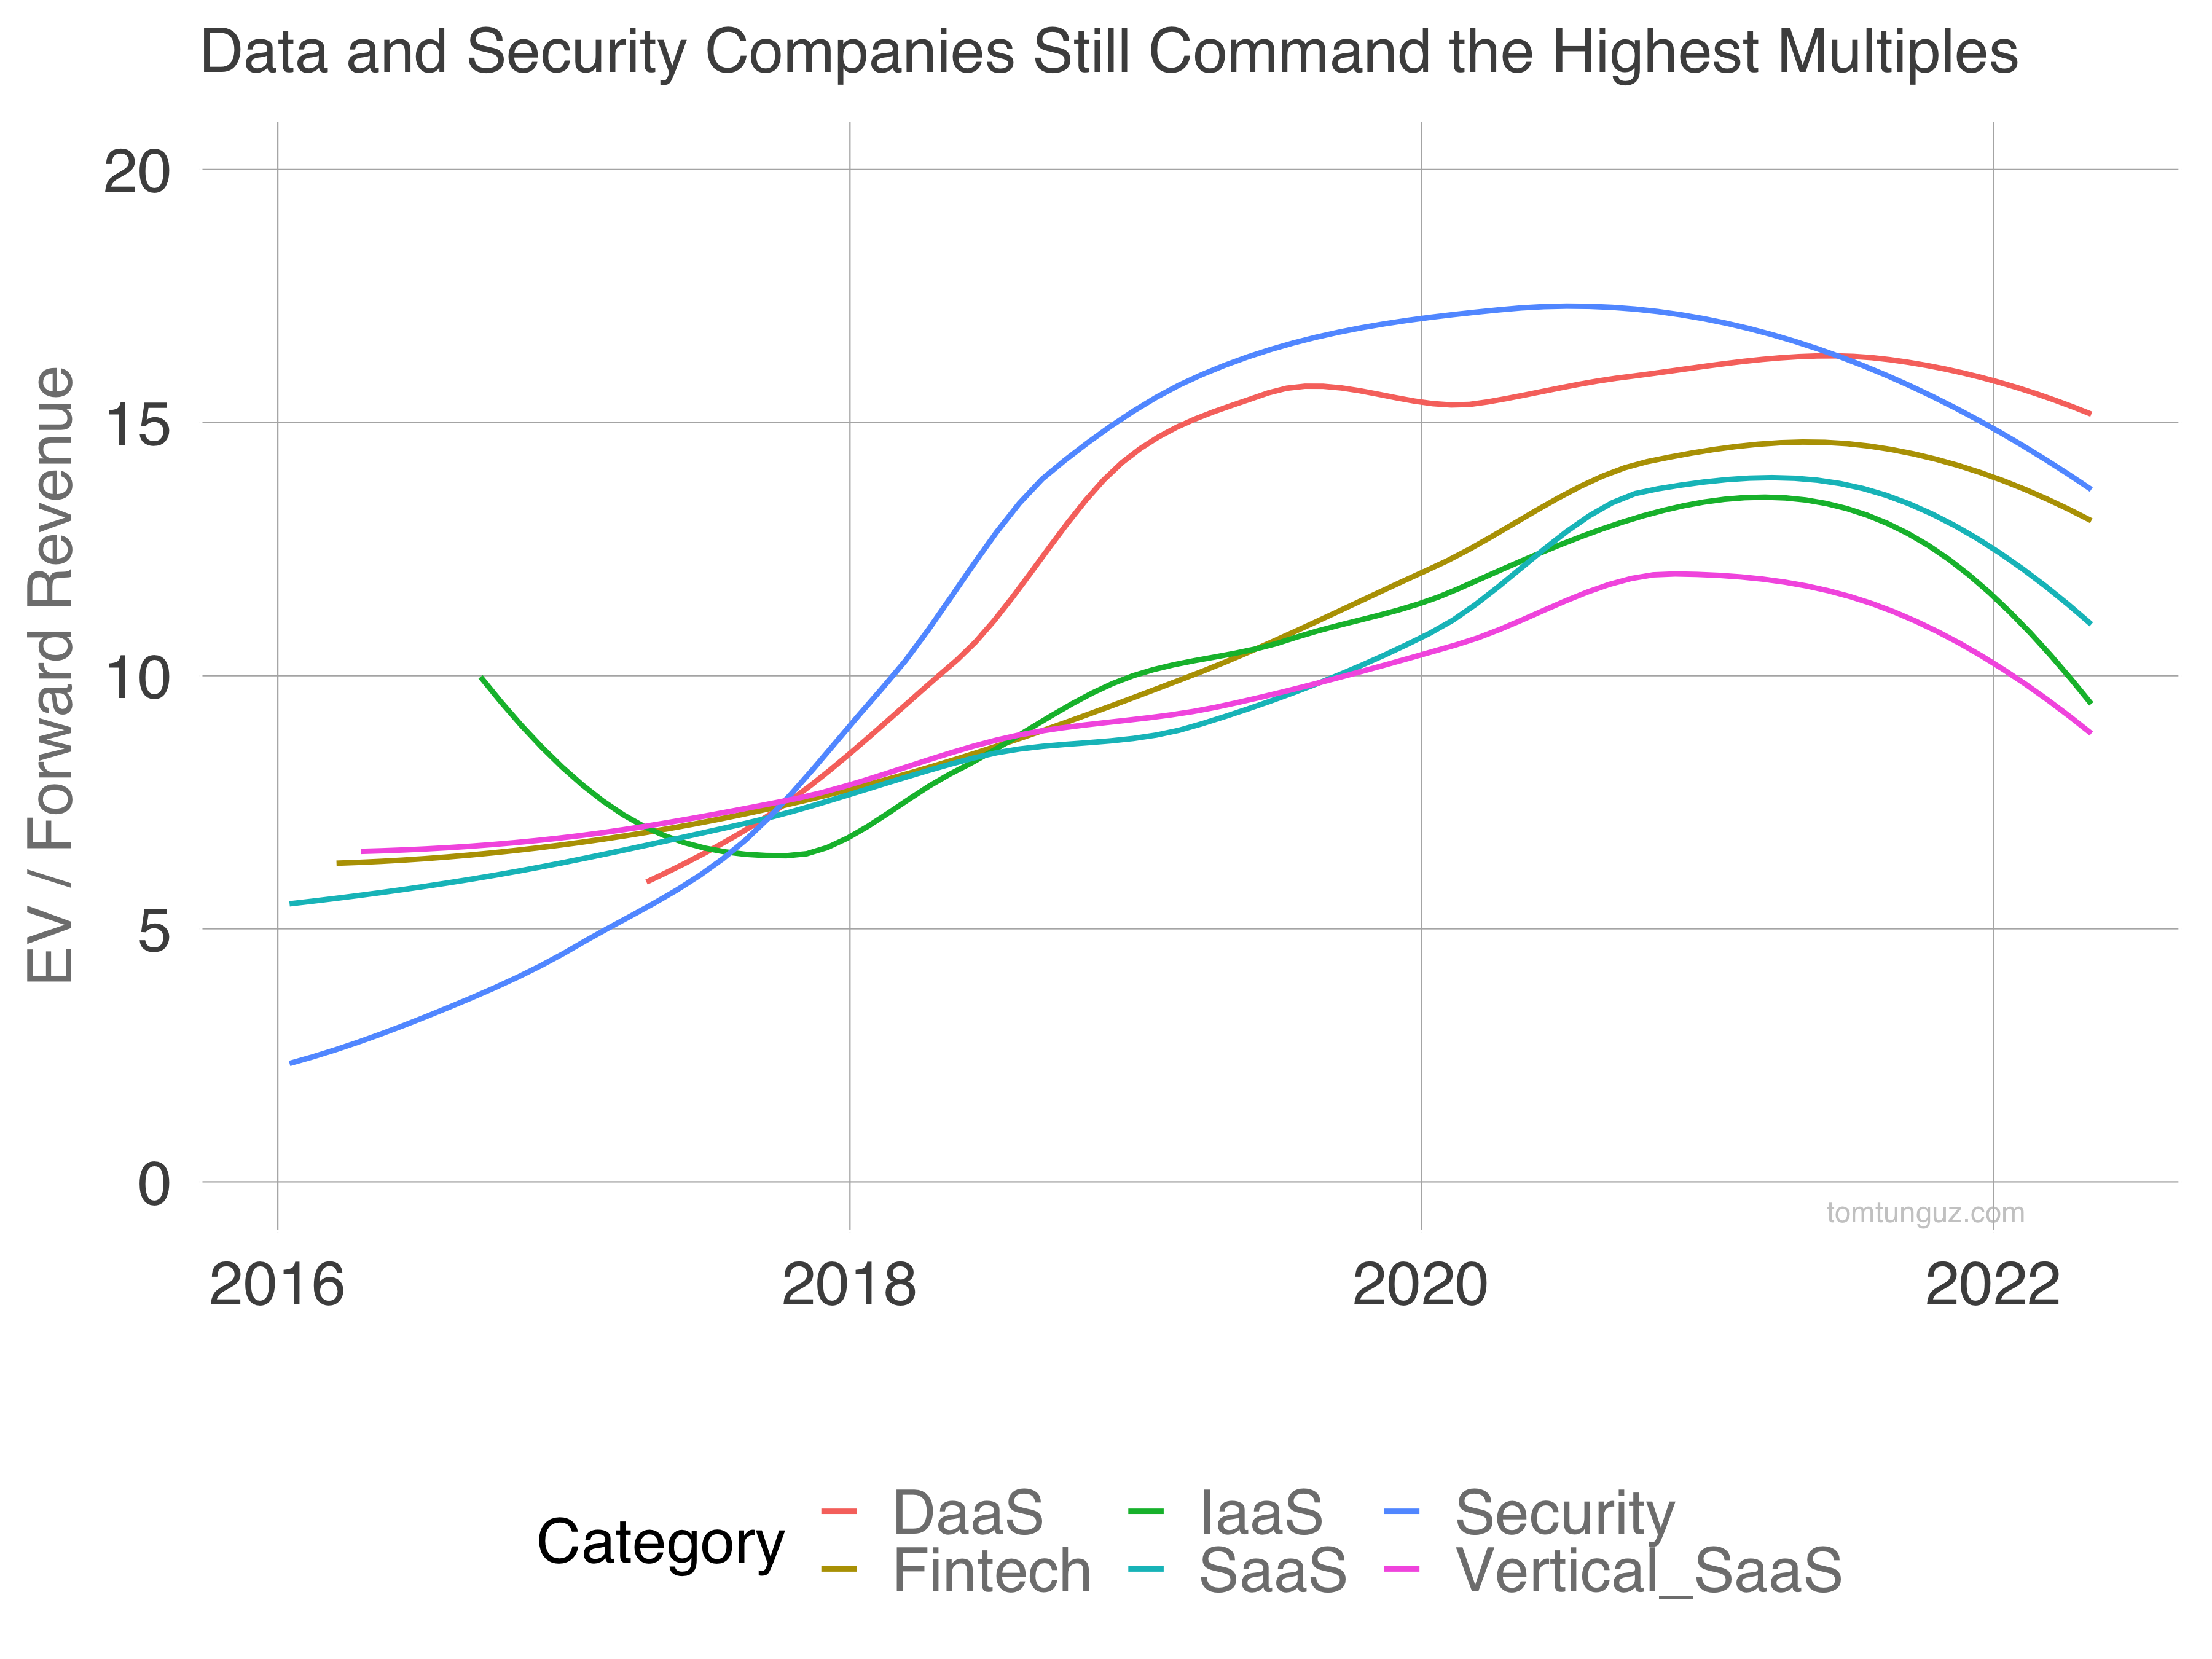
Examining multiples by sector, Security and Data commanded the juiciest premiums in 2019 and 2020, a trend paralleled in the private markets. Those categories have sustained the largest decline on a percentage basis. In the last year, the disparity across categories has narrowed. But the investor preference stack rank hasn’t changed.
Bear markets can be brutal because they resemble Xeno’s paradox of the race between Achilles and the tortoise. The market can keep halving a stock and never reach zero.