10 Predictions for Data at the Impact Summit

2020 is the decade of data. Look no further than the massive companies pushing the public & the private market forward: Snowflake, Databricks, Amazon, Azure, Google Cloud. It’s quite possible that data products have created more market cap than any other subsegment of SaaS in the last five years.

image

On October 25th, I’ll share my 10 predictions for data in 2023 at The Impact Data Summit.

Read more

Pipeline Supply Shocks in SaaS Sales

image 
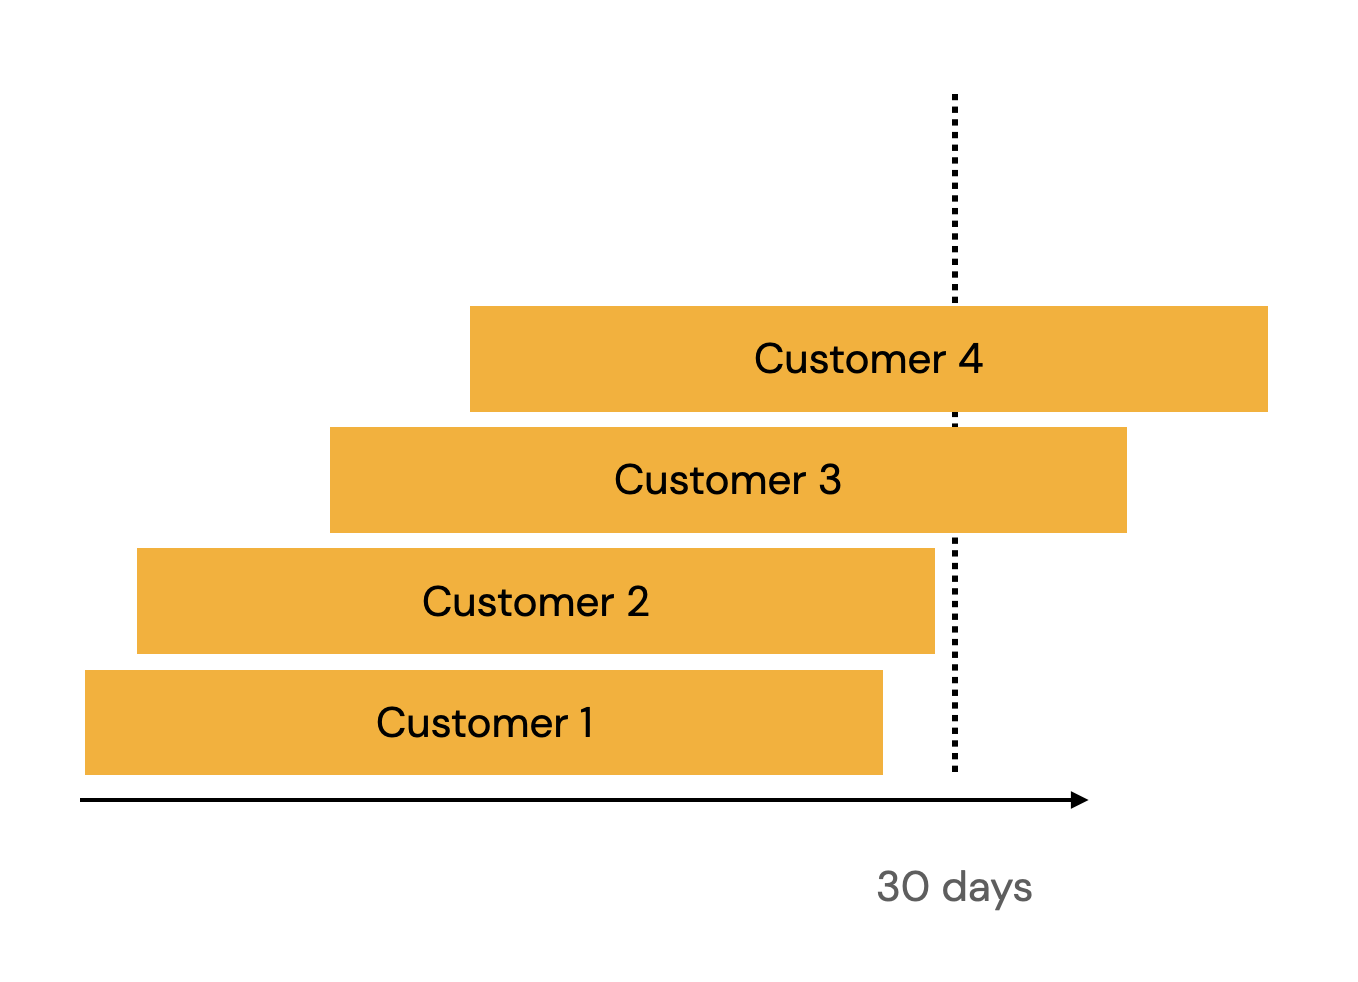
Imagine a startup with 4 customers in the pipeline. The average sales cycle is 28 days. Two of those customers should close this quarter. Two of them, who entered the funnel later in the month, will take longer than 30 days to close.

If the ACV of the company is $25k, then the business should project $50k in bookings this period & $50k next period (assuming no additional pipeline materializes).

Read more

Are We Seeing the Beginning of SaaS Consolidation?

The number of vendors selling to sales and marketing has exploded from 500 to more than 3000 over the last three years. Are we reaching the end of an expansionary cycle? The software pendulum tends to swing between software suites, offering a collection of different tools, and best-of-breed point solutions.

But, have we reached the point where the best-of-breed, fragmented ecosystem is a permanent fixture? Okta’s Businesses at Work 2016 report calculates most enterprises pay for somewhere between 10-15 corporate applications. Those are the ones sanctioned by IT. How about the others?

Read more

The State of Web3 in 2022 through Data

At the inaugural DuneCon, Dune’s first conference, I shared a presentation on the state of crypto in 2022.

I aimed to characterize the health of the crypto ecosystem at the most basic level. For example, quantifying the number of active wallets, the population of active developers, & other dynamics within the ecosystem.

The slides are embedded here with summary commentary below and linked here.

My Top 15 Observations from the Data:

  1. 2.5m wallets are active daily across web3. Flat wallet count likely means relatively constant GDP in the ecosystem. We need more products to attract new users to bring in more GDP.
  2. Binance, Solana, Polygon, & Ethereum wallets represent more than 80% of those daily active users.
  3. Centralized exchanges manage roughly 100m total active wallets.
  4. Trading volumes are down 60% which is mostly driven by asset price reductions. DEX average transaction size declined from $8k to $1.4k.
  5. Centralized & decentralized exchanges trade at the same multiple & move in lock step.
  6. NFT buyers outnumber DEX traders about 35:1 over the last 6 months but the traded volume is roughly equal between the two groups.
  7. NFT trading volumes have fallen 97% from the top.
  8. 40% of NFT buyers use Solana. Because the average Solana NFT is worth 10% of the average Ethereum NFT, Ethereum retains 90% of NFT traded value.
  9. L2s (Arbitrum & Optimism) account for 30-40% of all transactions on Ethereum, but consume only 2% of the total gas, cementing their value.
  10. About $250m flows into L2s each month.
  11. MEV (maximum or miner extracted value) has tapered off due to FlashBots’ searchers. Lower MEV means users pay lower fees when they trade because the market is more efficient.
  12. Developers push about 300,000 smart contracts to Ethereum every month, a figure that has been flat for the last five months.
  13. Roughly 5,000 developers push code to web3 every week, down 20% from the beginning of the year. This number needs to increase significantly for the ecosystem to thrive.
  14. Web3 companies (aside from L1s) have begun to trade at similar multiples to their web2 counterparts.
  15. Web3 multiples are increasingly correlated to revenue. The investor community has matured its understanding of how to value a web3 company. This milestone will begin to shift the early & late stage private markets’ valuations. This is why marketing will become so critical in the next 12 months.

Overall, the crypto ecosystem finds itself in a winter. I see it as the coiling of a spring. So much innovation has been unleashed in the last few years, most of us are still absorbing the implications & working to identify the best applications of the 4 fundamental innovations of web3.

Read more

Figma's 50x ARR Multiple & What it Means for Startup Fundraising

Today, Adobe announced its intention to acquire Figma for $20b, valuing the business at 50x current ARR, the highest multiple paid for any software company of scale. Congratulations to team Figma on building their impressive business.

Doesn’t this acquisition reset the market price despite this year’s 70% correction?

After the correction earlier this year, public valuation multiples had reset to those of 2017. That year, Cisco acquired AppDynamics for 17x trailing revenue. If we assume a company recognizes about 2/3 of its ARR as revenue, then I estimate the Adobe/Figma deal at roughly 75x trailing revenue.

Read more

Your Customers' Profitability is Your Startup's Future Health

Ten years ago today, I wrote a post titled “Choosing market segments on customer profitability.” How healthy are the business’s underling customers?

Today, that question matters more because of the recession than at any point in the last decade.

Selling to very profitable customers benefits a startup. Account executives can charge a highly profitable company more than one without much money. I compared the profit margins of selling to a grocery store, a restaurant & a software company to illustrate the point.

Read more

Systematizing Go-To-Market Hiring

This chart holds the secret to successful hiring of go-to-market teams. image

What is it? A stack rank of attributes within HubSpot account executive candidates that correlate to quota attainment. Preparation, adaptability, domain experience, & intelligence topped the list. Closing ability correlated negatively. The pushier the account executive, the worse the result. That result alone should encourage rethinking of AE interviewing.

Read more

Web3 Users Are Just Like Web2 Users

By my rough estimation, there are approximately 30m monthly active web3 users (getting closer to that 100m user mark!) The activity rates of those users mirror web2 finance apps.

image

MixPanel recorded the activity rate of web2 finance apps at 10.7% DAU/MAU. In other words, 11% of users who use the app every month, also use it daily.

Dune Analytics provides insight into the DAU / MAU of Ethereum users for August.

Read more

200% NDR: What Does it Take to Achieve this Stellar Milestone?

During Bill Binch’s Office Hours, he predicted many more software startups would achieve 200% net dollar retention. In other words, the average customer’s spend would double each year. I’ve only seen a handful of companies achieve that mark. The most notable public company is Snowflake which routinely reports NDR of 171%.

Large NDR figures are hugely beneficial to startups. They imply strong product market fit. They provide predictable revenue growth. They result in better capital efficiency, an important metric in this environment.

Read more

Don't Look Now But Web3 Companies are Beginning to Trade Like their Web2 Counterparts

image 
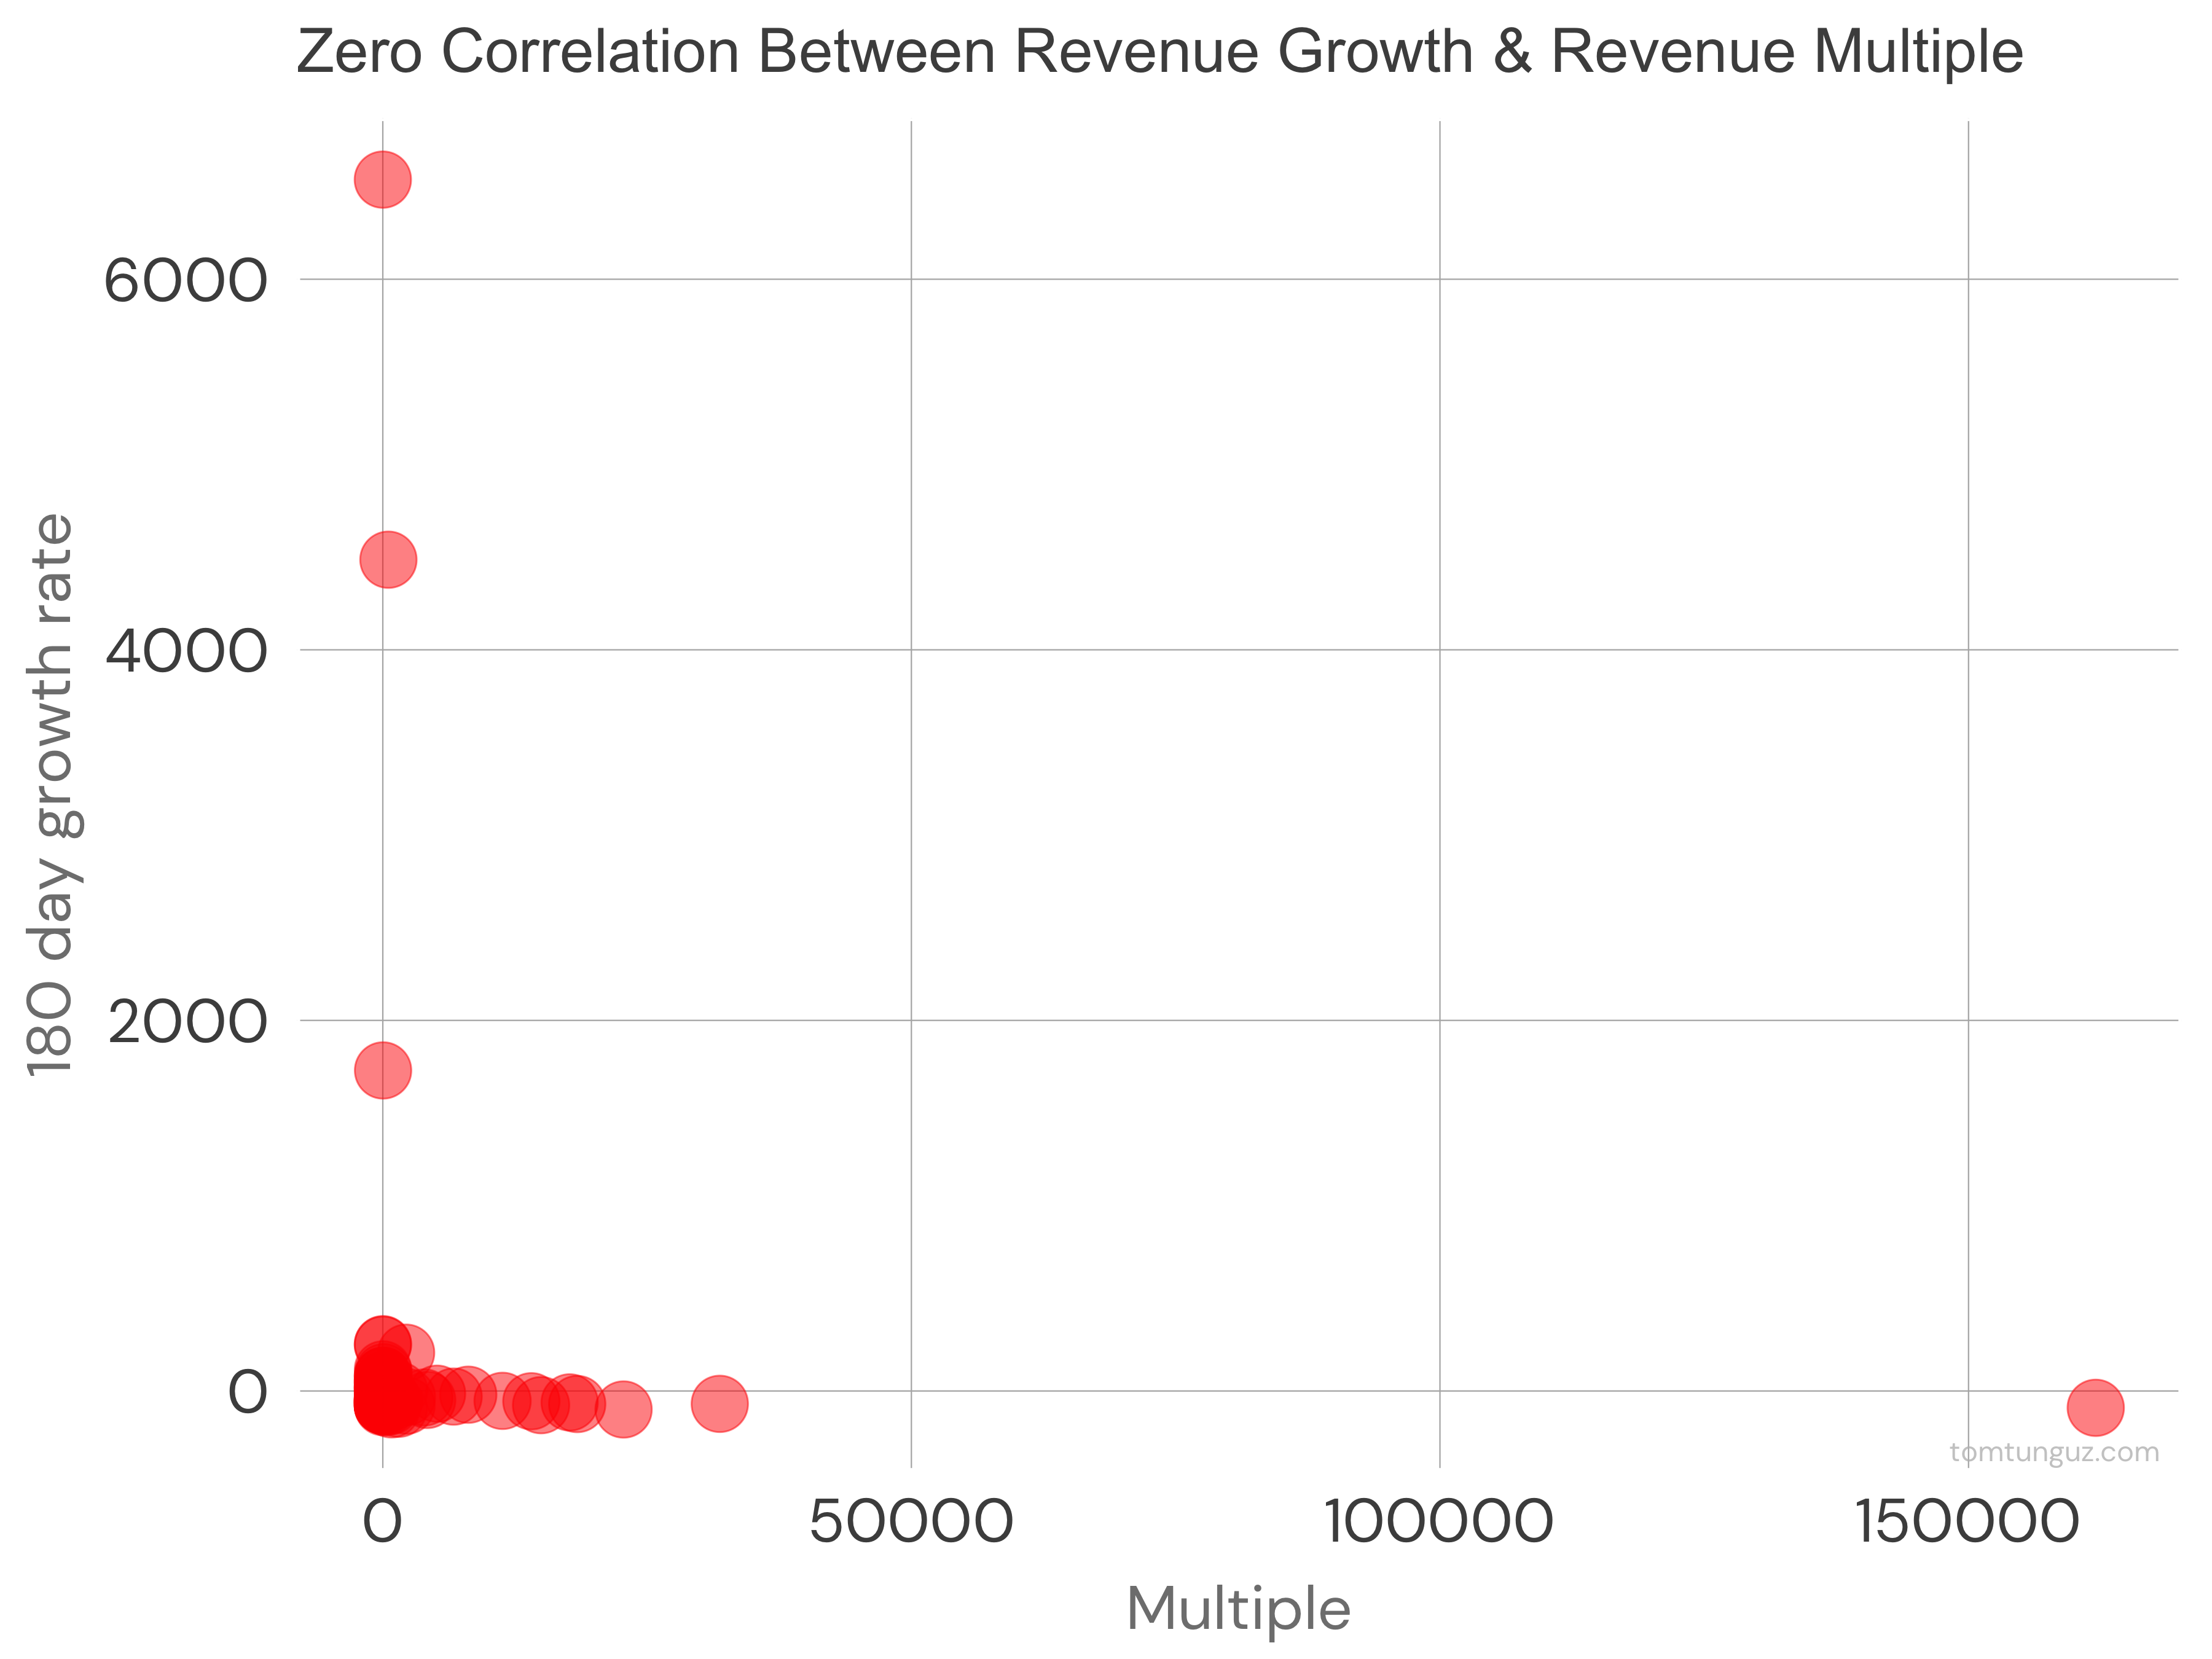
This chart shows the relationship between the top 100 public projects’ revenue and their trailing revenue multiple. There’s none. The correlation asymptotes to zero. At least when looking at the ecosystem as a whole.

But let’s break the data down by category into the top 5 by revenue: L1s (blockchains), DEXs (decentralized exchanges), Credit (lenders), NFT Marketplaces (buy & sell Bored Apes), & Yield Aggregators (systems to maximize interest rates on deposits).

Read more