Every major technology build-out requires two phases, according to Carlota Perez1: the infrastructure to power it, & then the applications to pay for it.
Between 1996 & 2005, American telecom companies spent $1.5t building the internet in today’s dollars.2 Meanwhile, applications riding on that infrastructure booked $180 billion of revenue.3
That’s an interesting ratio, isn’t it? Application revenue to infrastructure spend. It matters because the shorter the gap between the two, the sooner the infrastructure pays for itself. Let’s compare this to the AI era.
It would take a decade for dark fiber to fill its promise, flooded with the packets of application revenue. AI is achieving that mark in half the time.

AI hit double digits in its fourth year. Plus, the unit economics from companies like SpaceX suggest that the paybacks on the infrastructure from this revenue are short, about a year.4

US venture invested $516b in the first nine months of 2026. That is already 44% above the full-year record set in 2021.5 Inflation-adjusted, the run-up in venture investment is roughly two & a half times the size of the earlier era.6
In a very real sense, the entire ecosystem is hoping the gap between application revenue & infrastructure investment is significantly shorter on an inflation-adjusted basis. Cumulative venture investment in this wave is about six times the first four years of the web era.6
The major risk is whether the ecosystem is an ouroboros: is all the spend just within startups?7
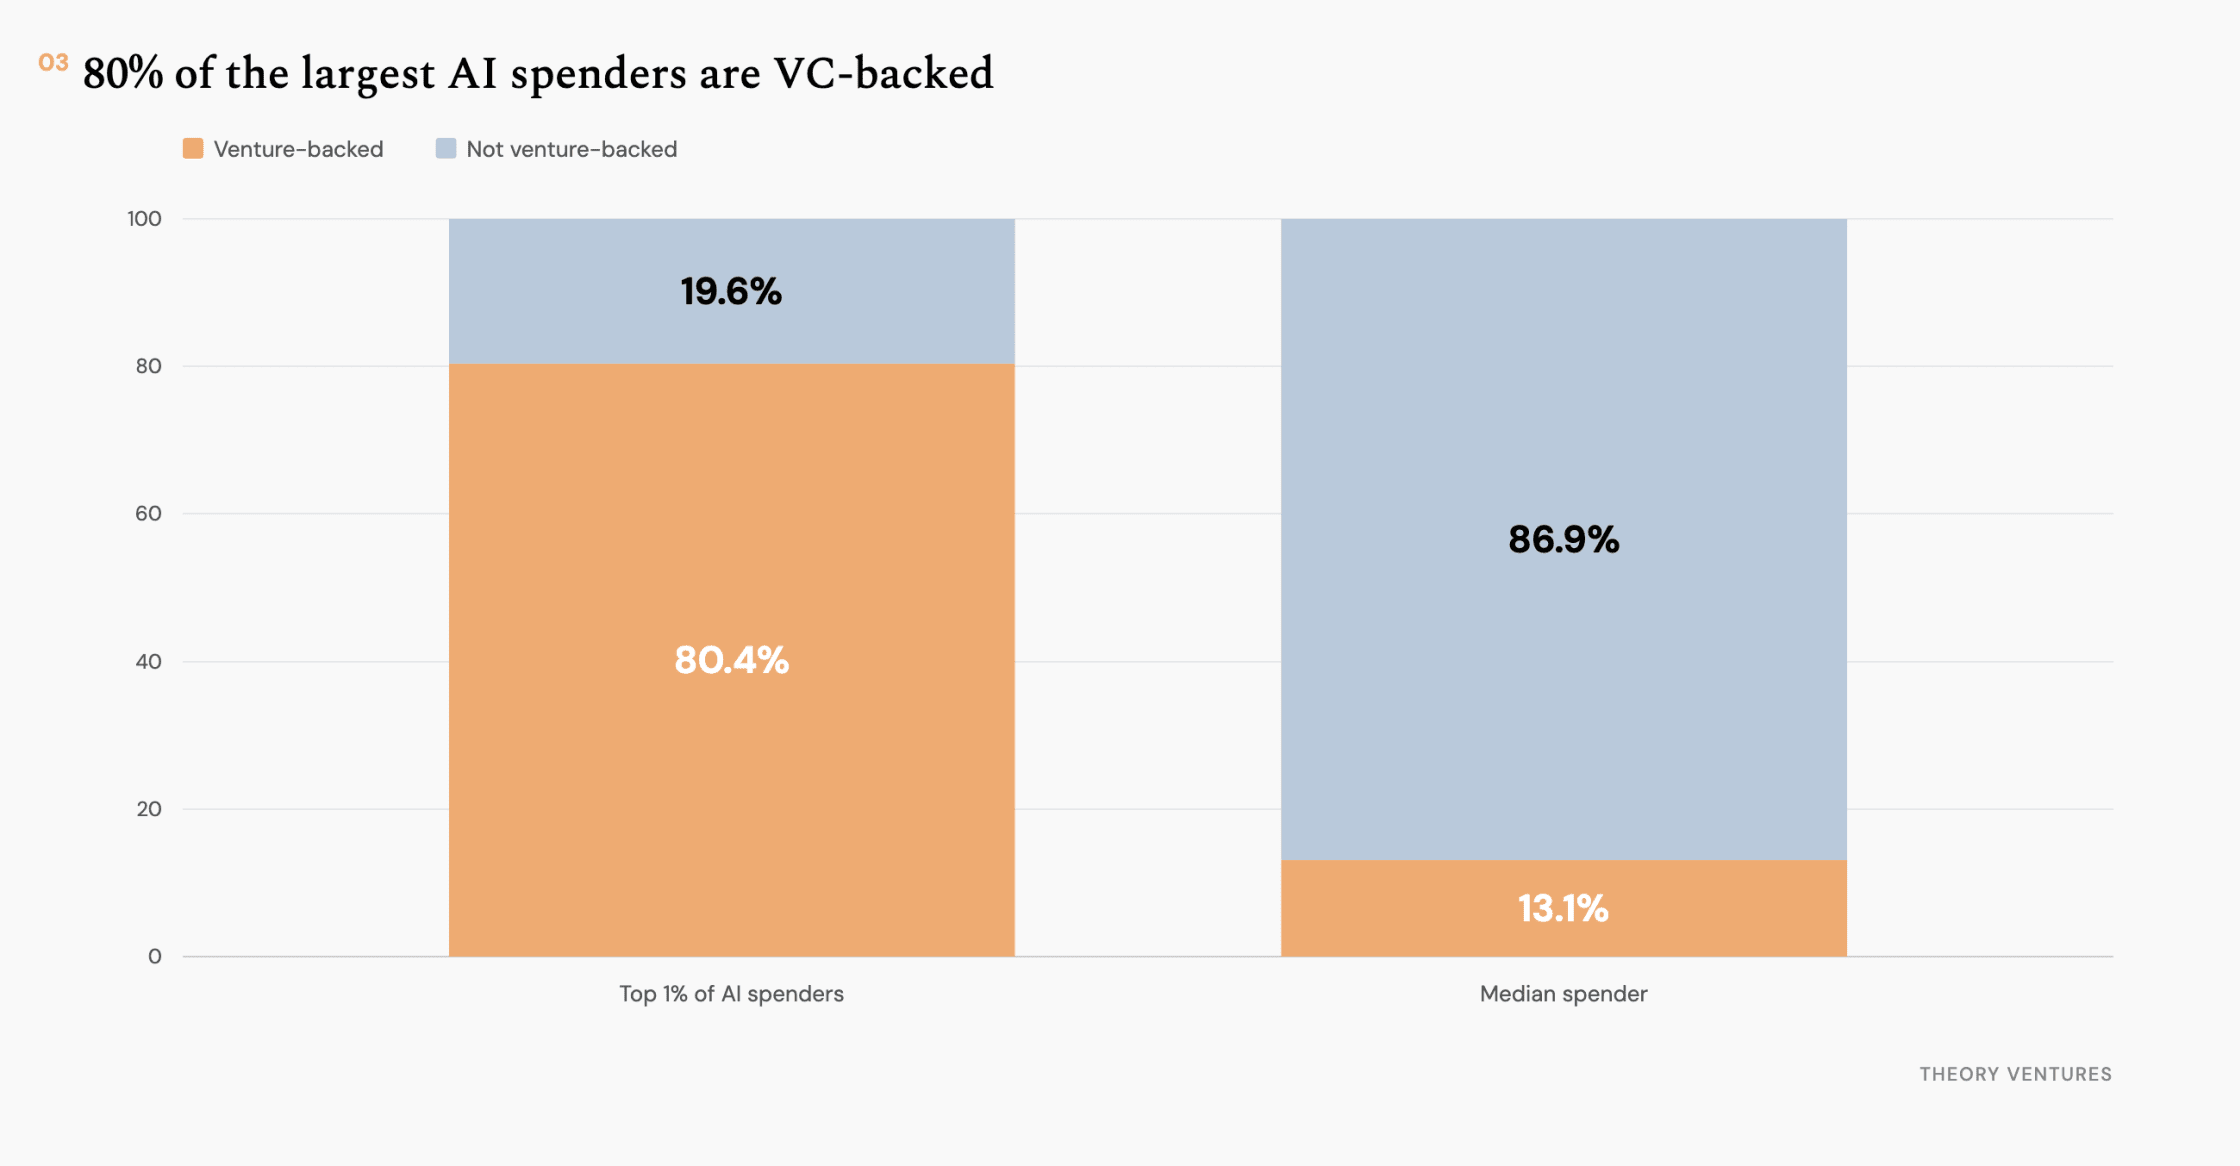
Ramp’s data show that 80% of the largest AI spenders are venture-backed. Those firms now account for more than 13% of American employment, up from about 5% during the web era. The circularity is real, but the circle is a sixth of the economy.
That is a much larger circle.8
-
Perez, Technological Revolutions and Financial Capital, 2002. Her central mechanism is a sequence: installation of infrastructure, then financial speculation, then a turning point, then deployment of the applications that justify the spending. ↩︎
-
USTelecom historical broadband provider capex, all-in across wireline, wireless & cable. Nominal spend of $761.9b for 1996-2005, converted to 2026 dollars with CPI-U (2.116 to 1.699 across the period). ↩︎
-
A 24-company panel from SEC 10-K and S-1 filings: Amazon, Yahoo, Google, eBay, Priceline, Expedia, Travelocity, Overstock, Netflix, DoubleClick, Overture, Ask Jeeves, LookSmart, Excite, E*Trade, Ameritrade, Schwab online, Monster, CNET, WebMD, Salesforce, MSN, Hotmail and Match. The 2001-2005 figures are a floor; four companies never broke out their online revenue. Google & Yahoo are gross of traffic acquisition cost. Nominal $100.9b, converted to 2026 dollars, or about $182b; rounded in the text to $180b. ↩︎
-
SpaceX’s third-quarter S-1 states that “at current pricing, new compute deployments are generating a payback of less than a year.” Working through the figures in the GPU revenue ladder: a $46 per watt build costs $55,200 per card, and the $5.27 contract rate yields $46,165 of annual revenue against roughly $570 of cash operating cost, giving about a year at 1.21 years. At B200 spot prices it is 0.72 years. Reconciling the quote to a $46 per watt build implies an after-tax measure: at a 21% federal rate, bonus depreciation lifts first-year cash flow to $57,187 & shortens payback to 0.97 years, though that is a timing benefit rather than a cost reduction. ↩︎
-
PitchBook-NVCA Venture Monitor, Q3 2026, as of 30 September. The 2026 figure is nine months, not a full year, & is plotted unannualized. The full-year 2021 record was $357.9b. AI companies took 82.7% of 2026 deal value, the highest share in the dataset. ↩︎
-
Cumulative venture investment in 2026 dollars was $201.8b across the first four years of the web era (1996-1999) & $1.24t across the first four years of the AI era (2023-2026), a ratio of 6.2x. Measured against the web era’s entire decade ($630.3b) rather than its first four years, the same $1.24t is 2.0x. The four-year comparison is used in the text because it matches the two eras on elapsed time. Sources are NVCA/MoneyTree for 1996-2005, the NVCA 2026 Yearbook for 2023-2025, & the PitchBook-NVCA Venture Monitor for 2026, all inflated to 2026 dollars with CPI-U. The 2026 figure covers nine months, so the full-year multiple will be higher. ↩︎ ↩︎
-
Apollo’s analysis of the Ramp AI Index, published 22 October 2026, finds that 80.4% of the top 1% of AI spenders are venture-backed, against 13.1% for the median spender. Ramp separately reports that 80% of spend on OpenAI & Anthropic is driven by 1% of firms. Three caveats matter here. The chart measures dollars spent, not tokens, so it cannot support a claim about token share. Ramp’s sample is 85,000+ US businesses skewed toward tech, drawn from card & bill-pay data, & excludes free tools & personal-account shadow AI, which Ramp estimates at roughly 40% of AI application spend. And venture backing is not the same as venture dollars paying for the tokens: the chart shows the funding status of high-spending firms, not the source of the spend. Apollo is using the number to advance a circularity thesis & Ramp sells spend-management software, so both have an interest in it being vivid. ↩︎
-
Puri & Zarutskie put the employment share of venture-backed firms at roughly 4-7% across 1991-2005, using Census firm-level data; the Census Annual Business Survey and Longitudinal Business Database, as analysed by Ando (2025), put it near 13% for 2017-2021. The two estimates use different sources and slightly different definitions of venture backing, so this is a directional comparison across eras rather than a continuous series. Venture-backed firms remain about 0.64% of all US firms, so the employment share reflects their disproportionate size rather than their number. ↩︎