Benchmarking SaaS Startup Efficiency with Revenue per Employee Metrics
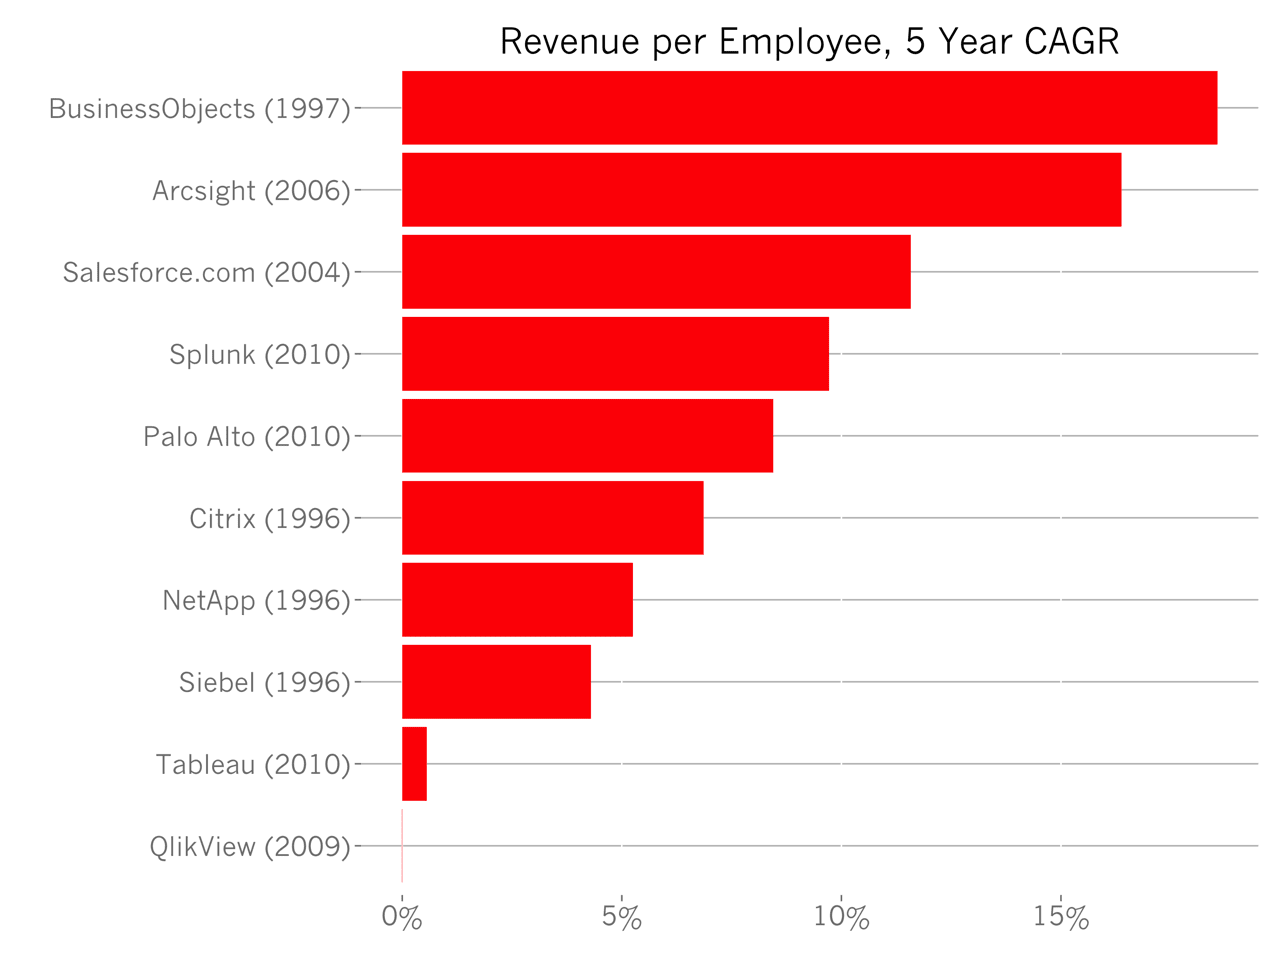
In the past, we have benchmarked the revenue per employee of large publicly traded SaaS companies and determined that the average is about $200k of revenue per person. But, that analysis examined revenue per employee that only one point in time.
As Jesse Hulsing pointed out to me, examining this figure over five years reveals quite a bit about the health of the business. Jesse was kind enough to provide data on a handful of category defining enterprise companies, which I’ve used in this analysis.