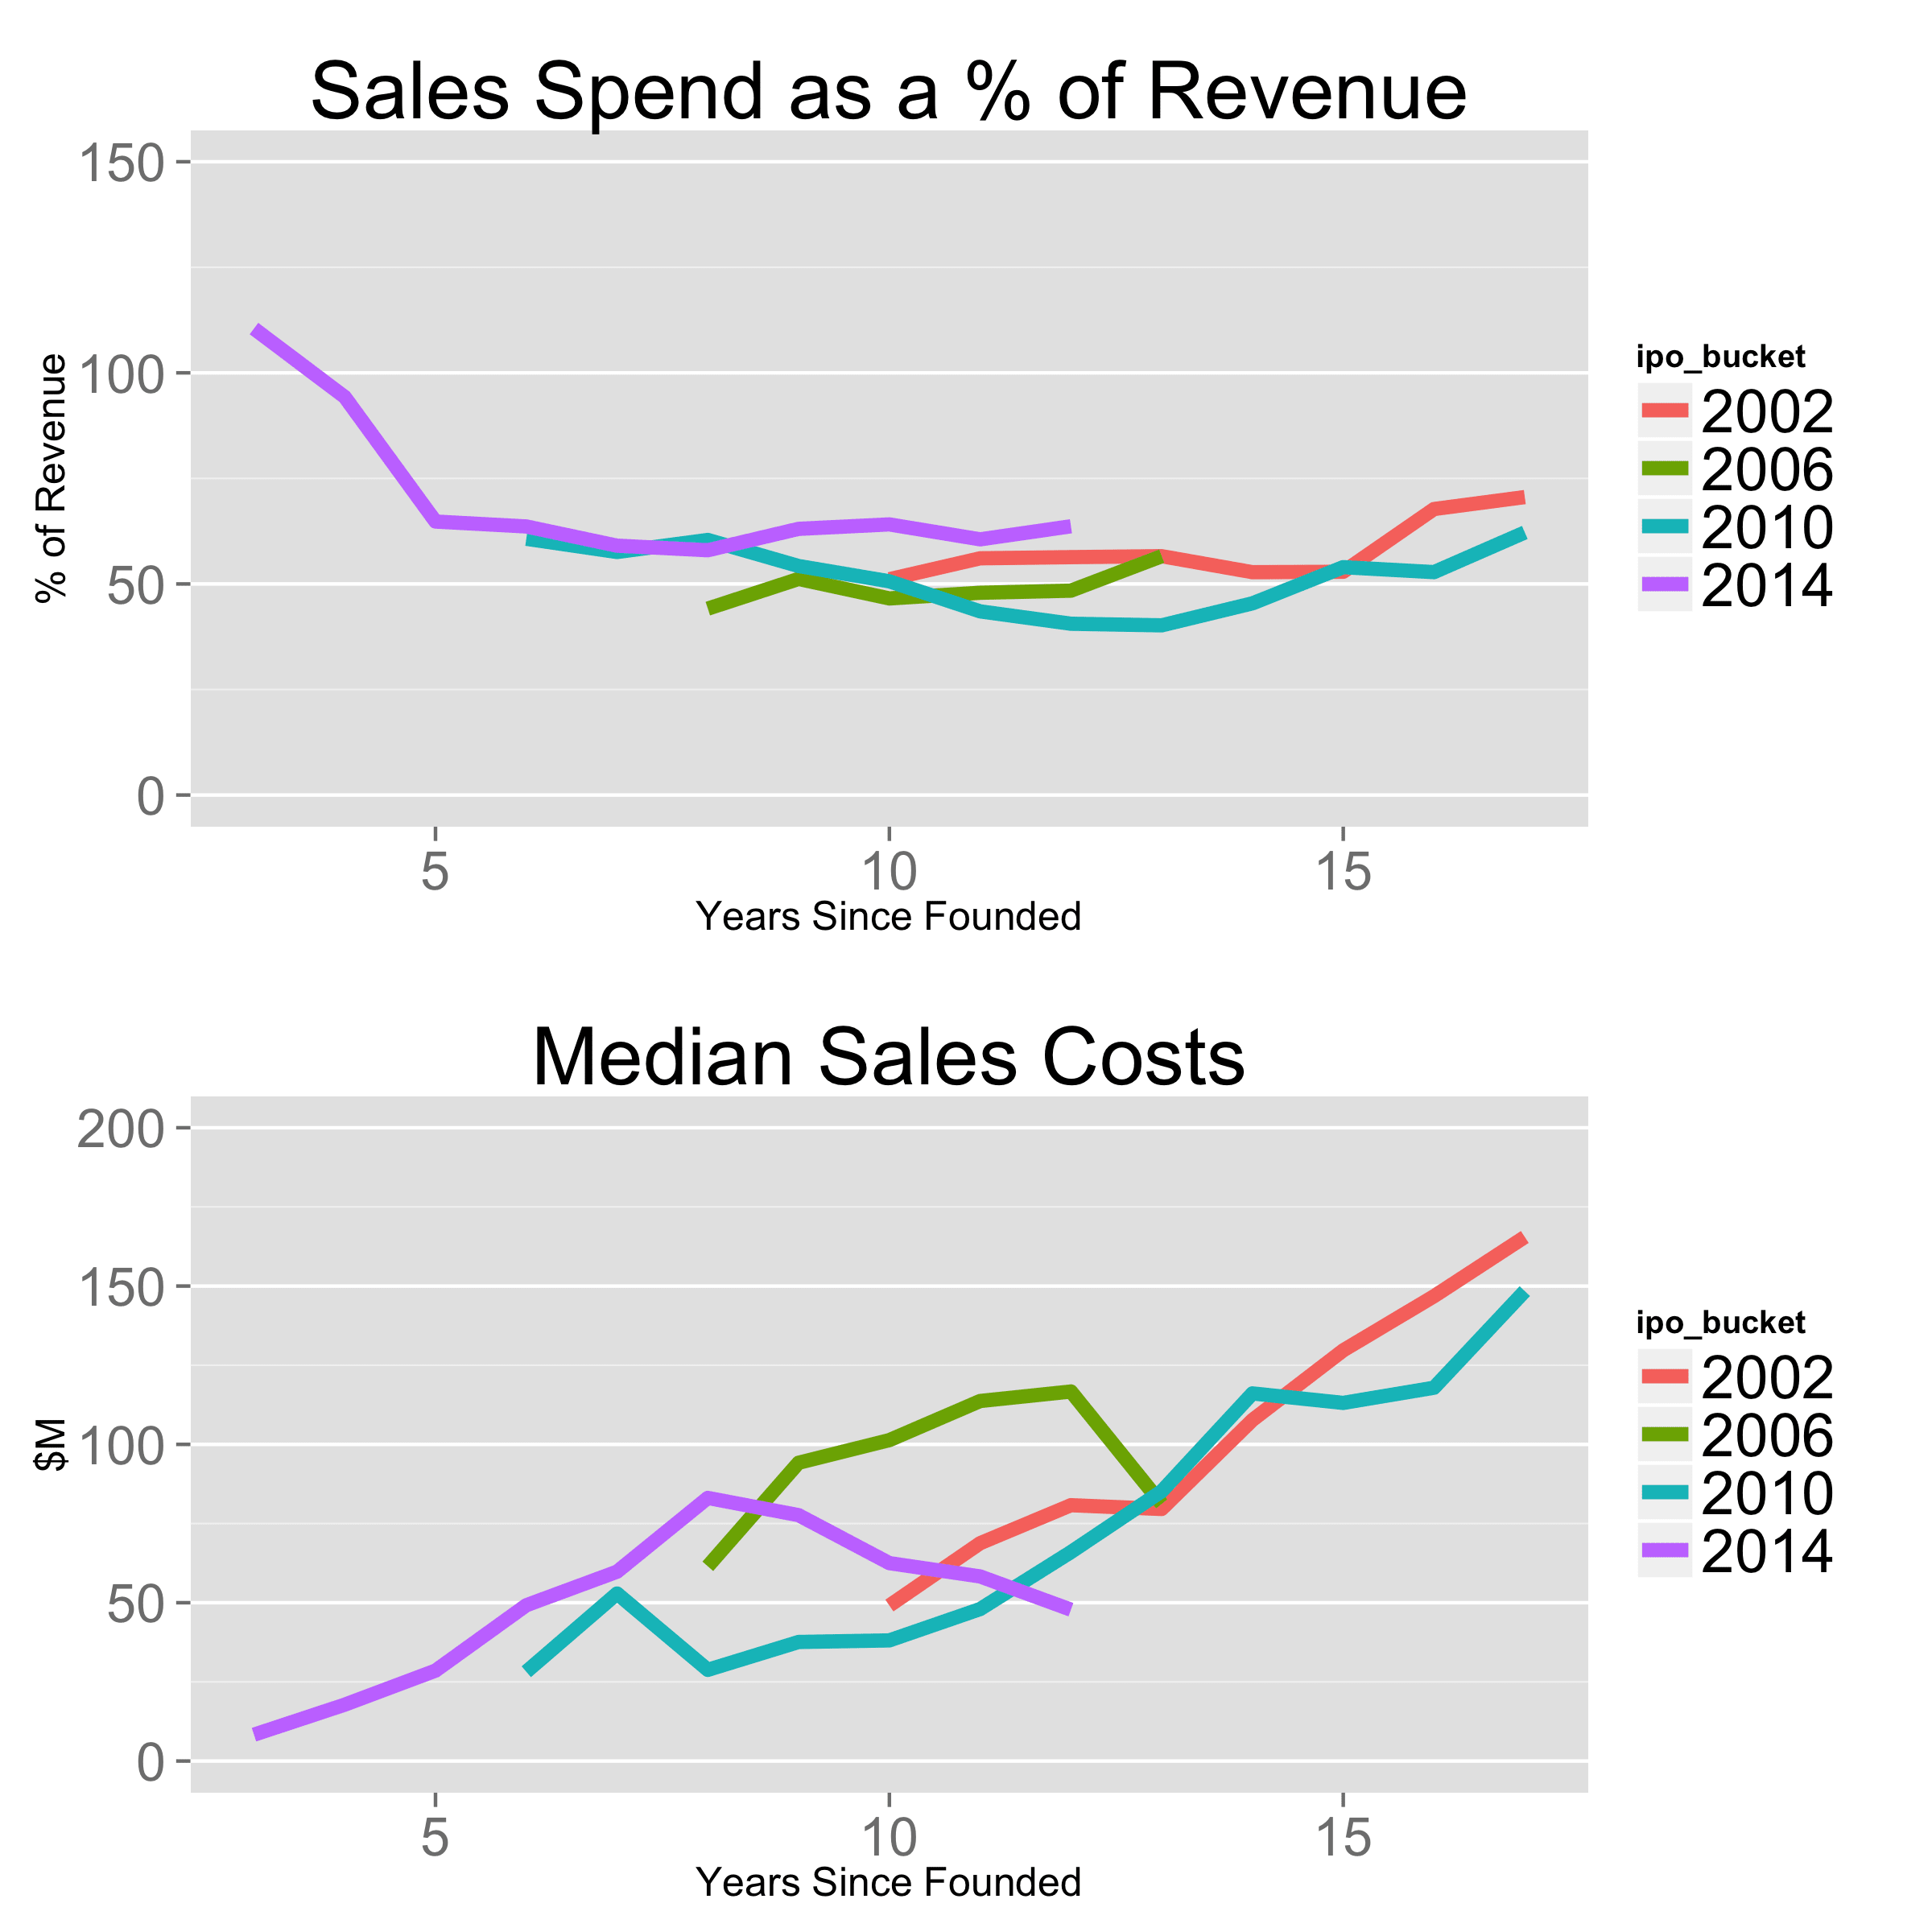
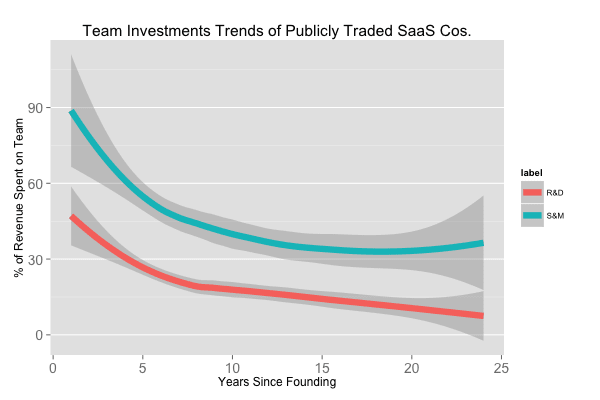
The Investment Patterns of SaaS Companies in Sales and Engineering Over Time
Analyze how modern SaaS startups allocate more to sales & engineering vs older companies, with 50% revenue going to sales. Key spending patterns across IPO cohorts.
Analyzing the 23% decline in SaaS valuations: Why the market correction isn't as dramatic as it seems, backed by data showing 21% nine-month growth.
Explore how modern SaaS startups achieve 2x revenue-on-invested-capital vs 1998, with data showing increased capital efficiency for venture-backed companies.
Analyze financing data from 41 public SaaS companies: from $4M to $400M raised pre-IPO. Key insights on capital efficiency and growth paths in modern cloud startups.
Analyze Box's IPO metrics vs 40 public SaaS companies. Deep-dive into growth rates, revenue, and profitability data reveals key startup benchmarks at 9 years.
Discover key revenue-per-employee benchmarks for SaaS companies, from Google's $1M/employee to the industry average of $200k. Data-driven insights for startup leaders.
Discover the true costs of taking your startup public. New data shows tech IPOs pay 8.8% in fees on average, with detailed breakdowns across 360 VC-backed companies.
Discover the optimal engineer-to-sales ratio in $1B+ SaaS companies. Data from 36 public startups shows 2:1 sales-to-engineering ratio drives growth from founding to IPO.
Discover why growth rate explains 50% of startup IPO valuations in 2013, while profitability shows zero correlation. Data analysis of 25 tech IPOs reveals key trends.
New data reveals post-Series A founder CEOs taking 24% less salary but 32% more equity. Analysis of 800 startups shows shifting compensation trends in venture-backed companies.