FEBRUARY 3, 2014
The Optimal Average Customer Value for SaaS Startups
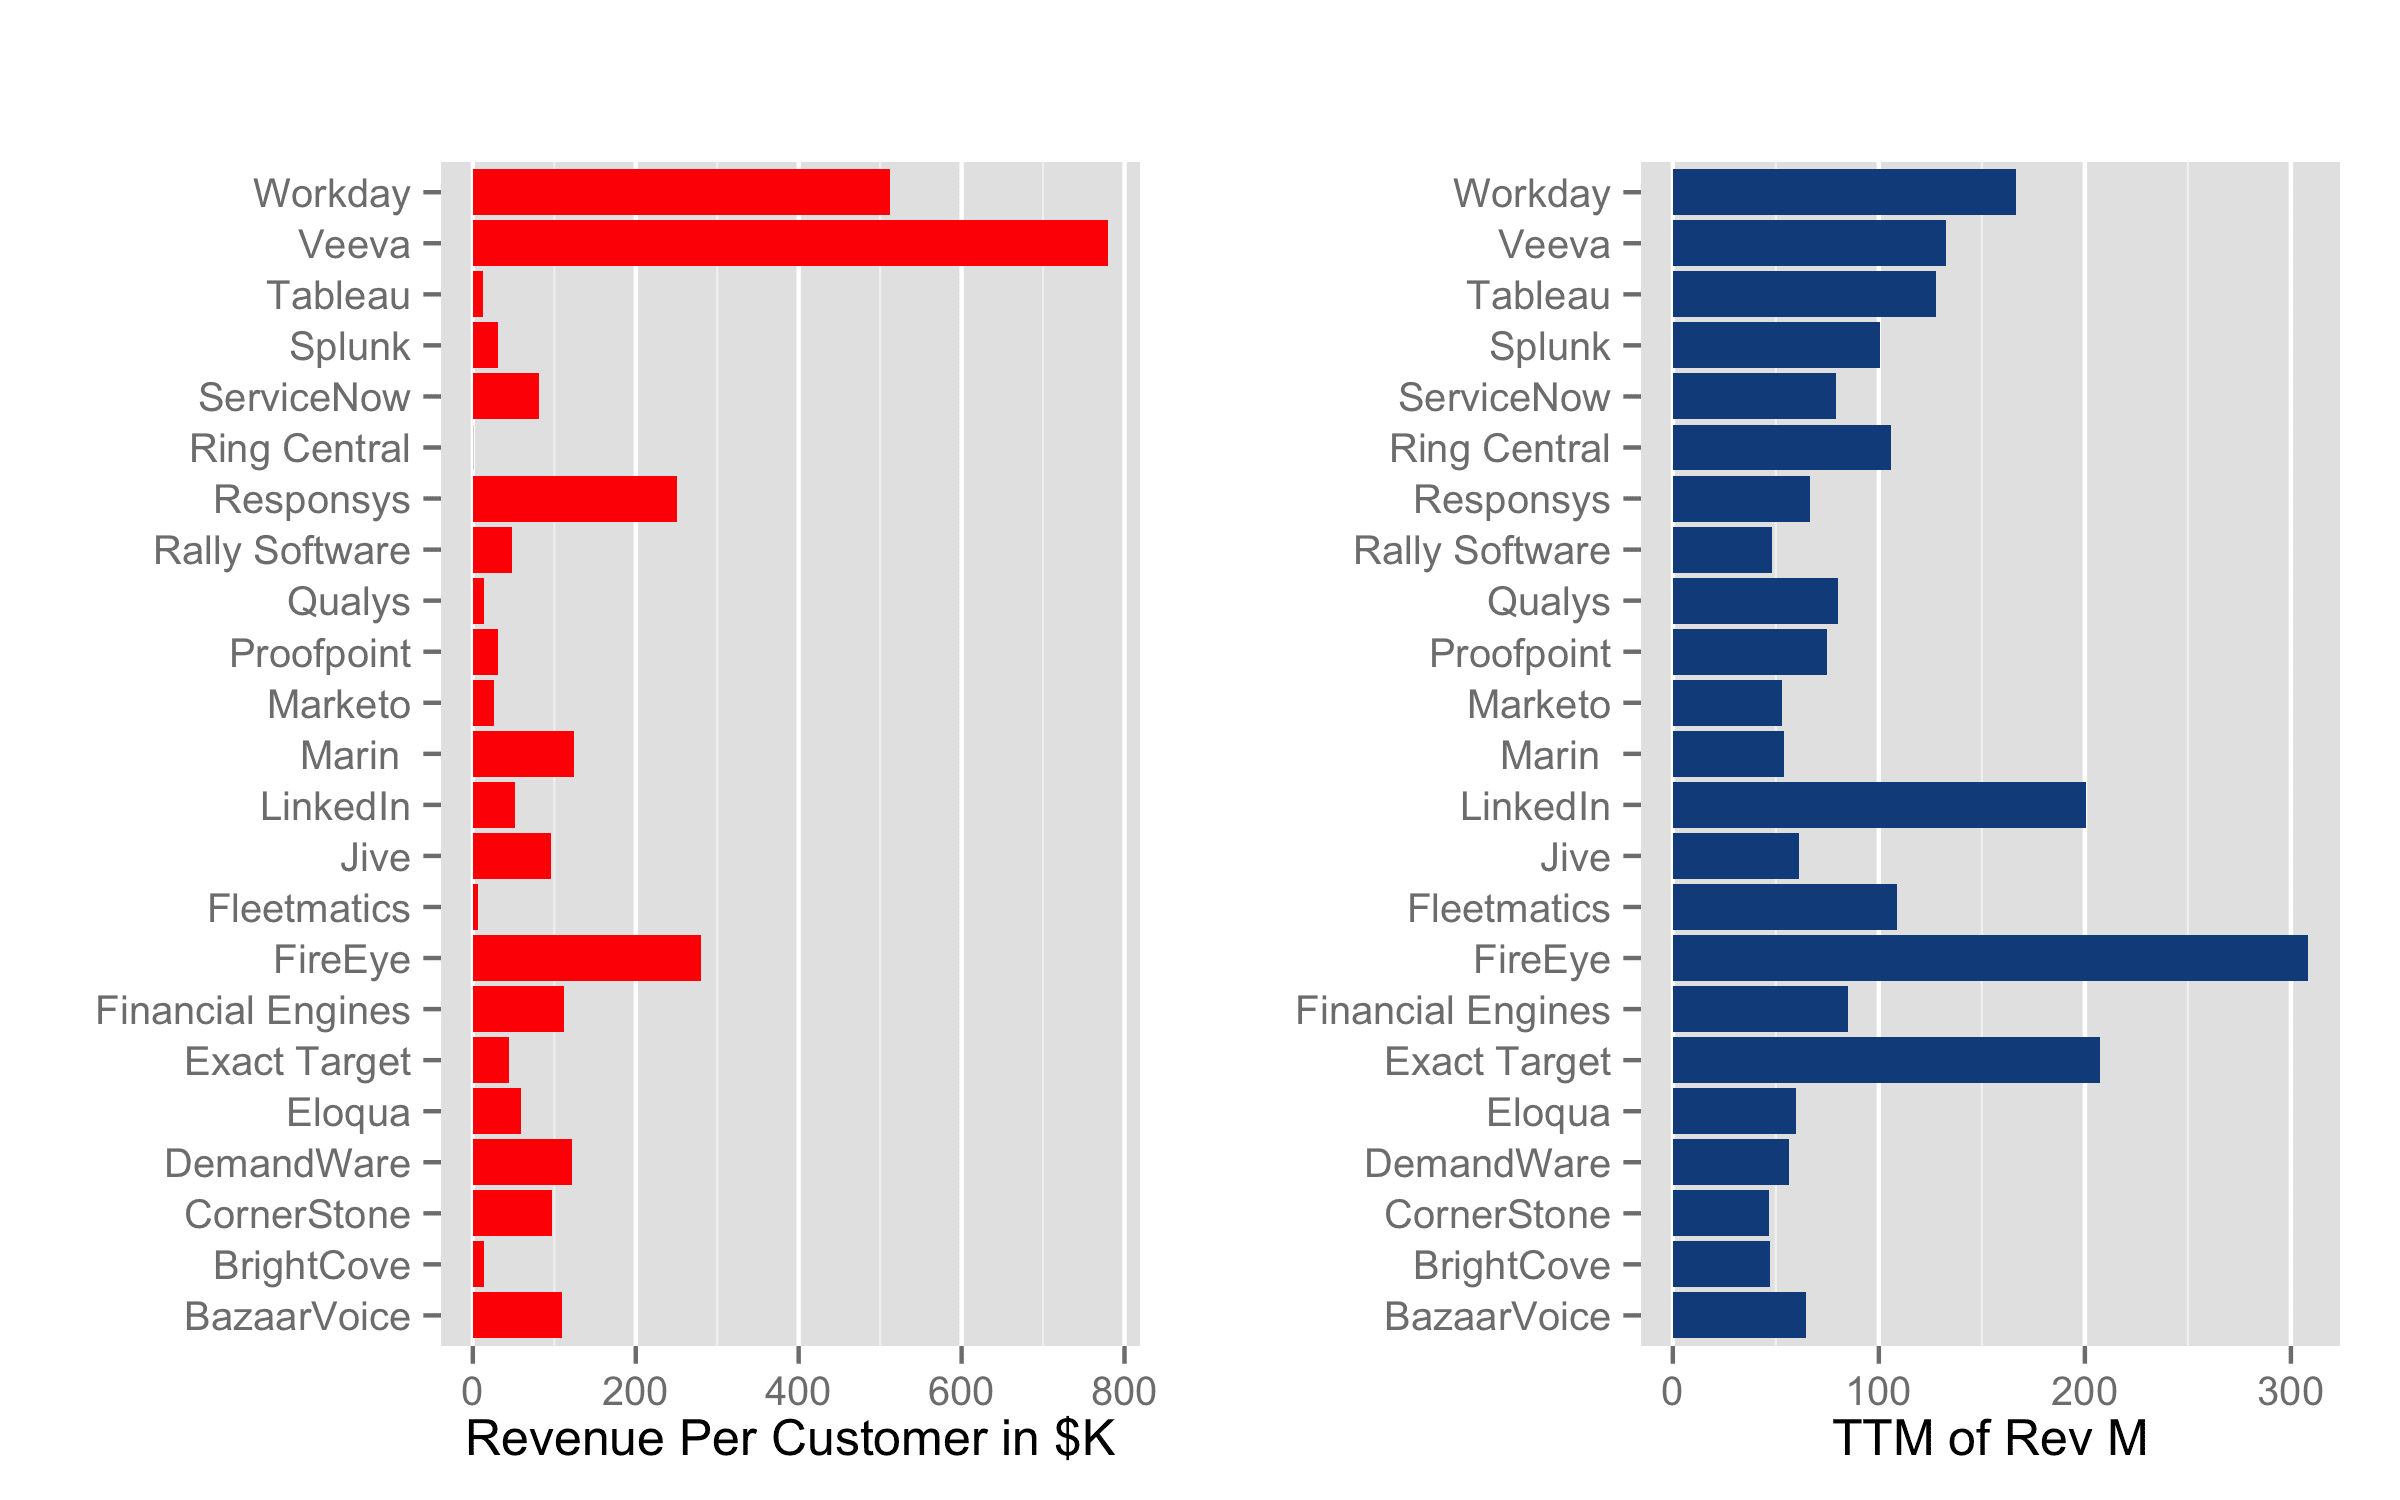
Analyze the optimal customer value strategy for SaaS startups with real IPO data. Key finding: Revenue per customer shows only 0.3 R² correlation with total revenue.