Why There's Never Been a Better Time to Found a SaaS Startup
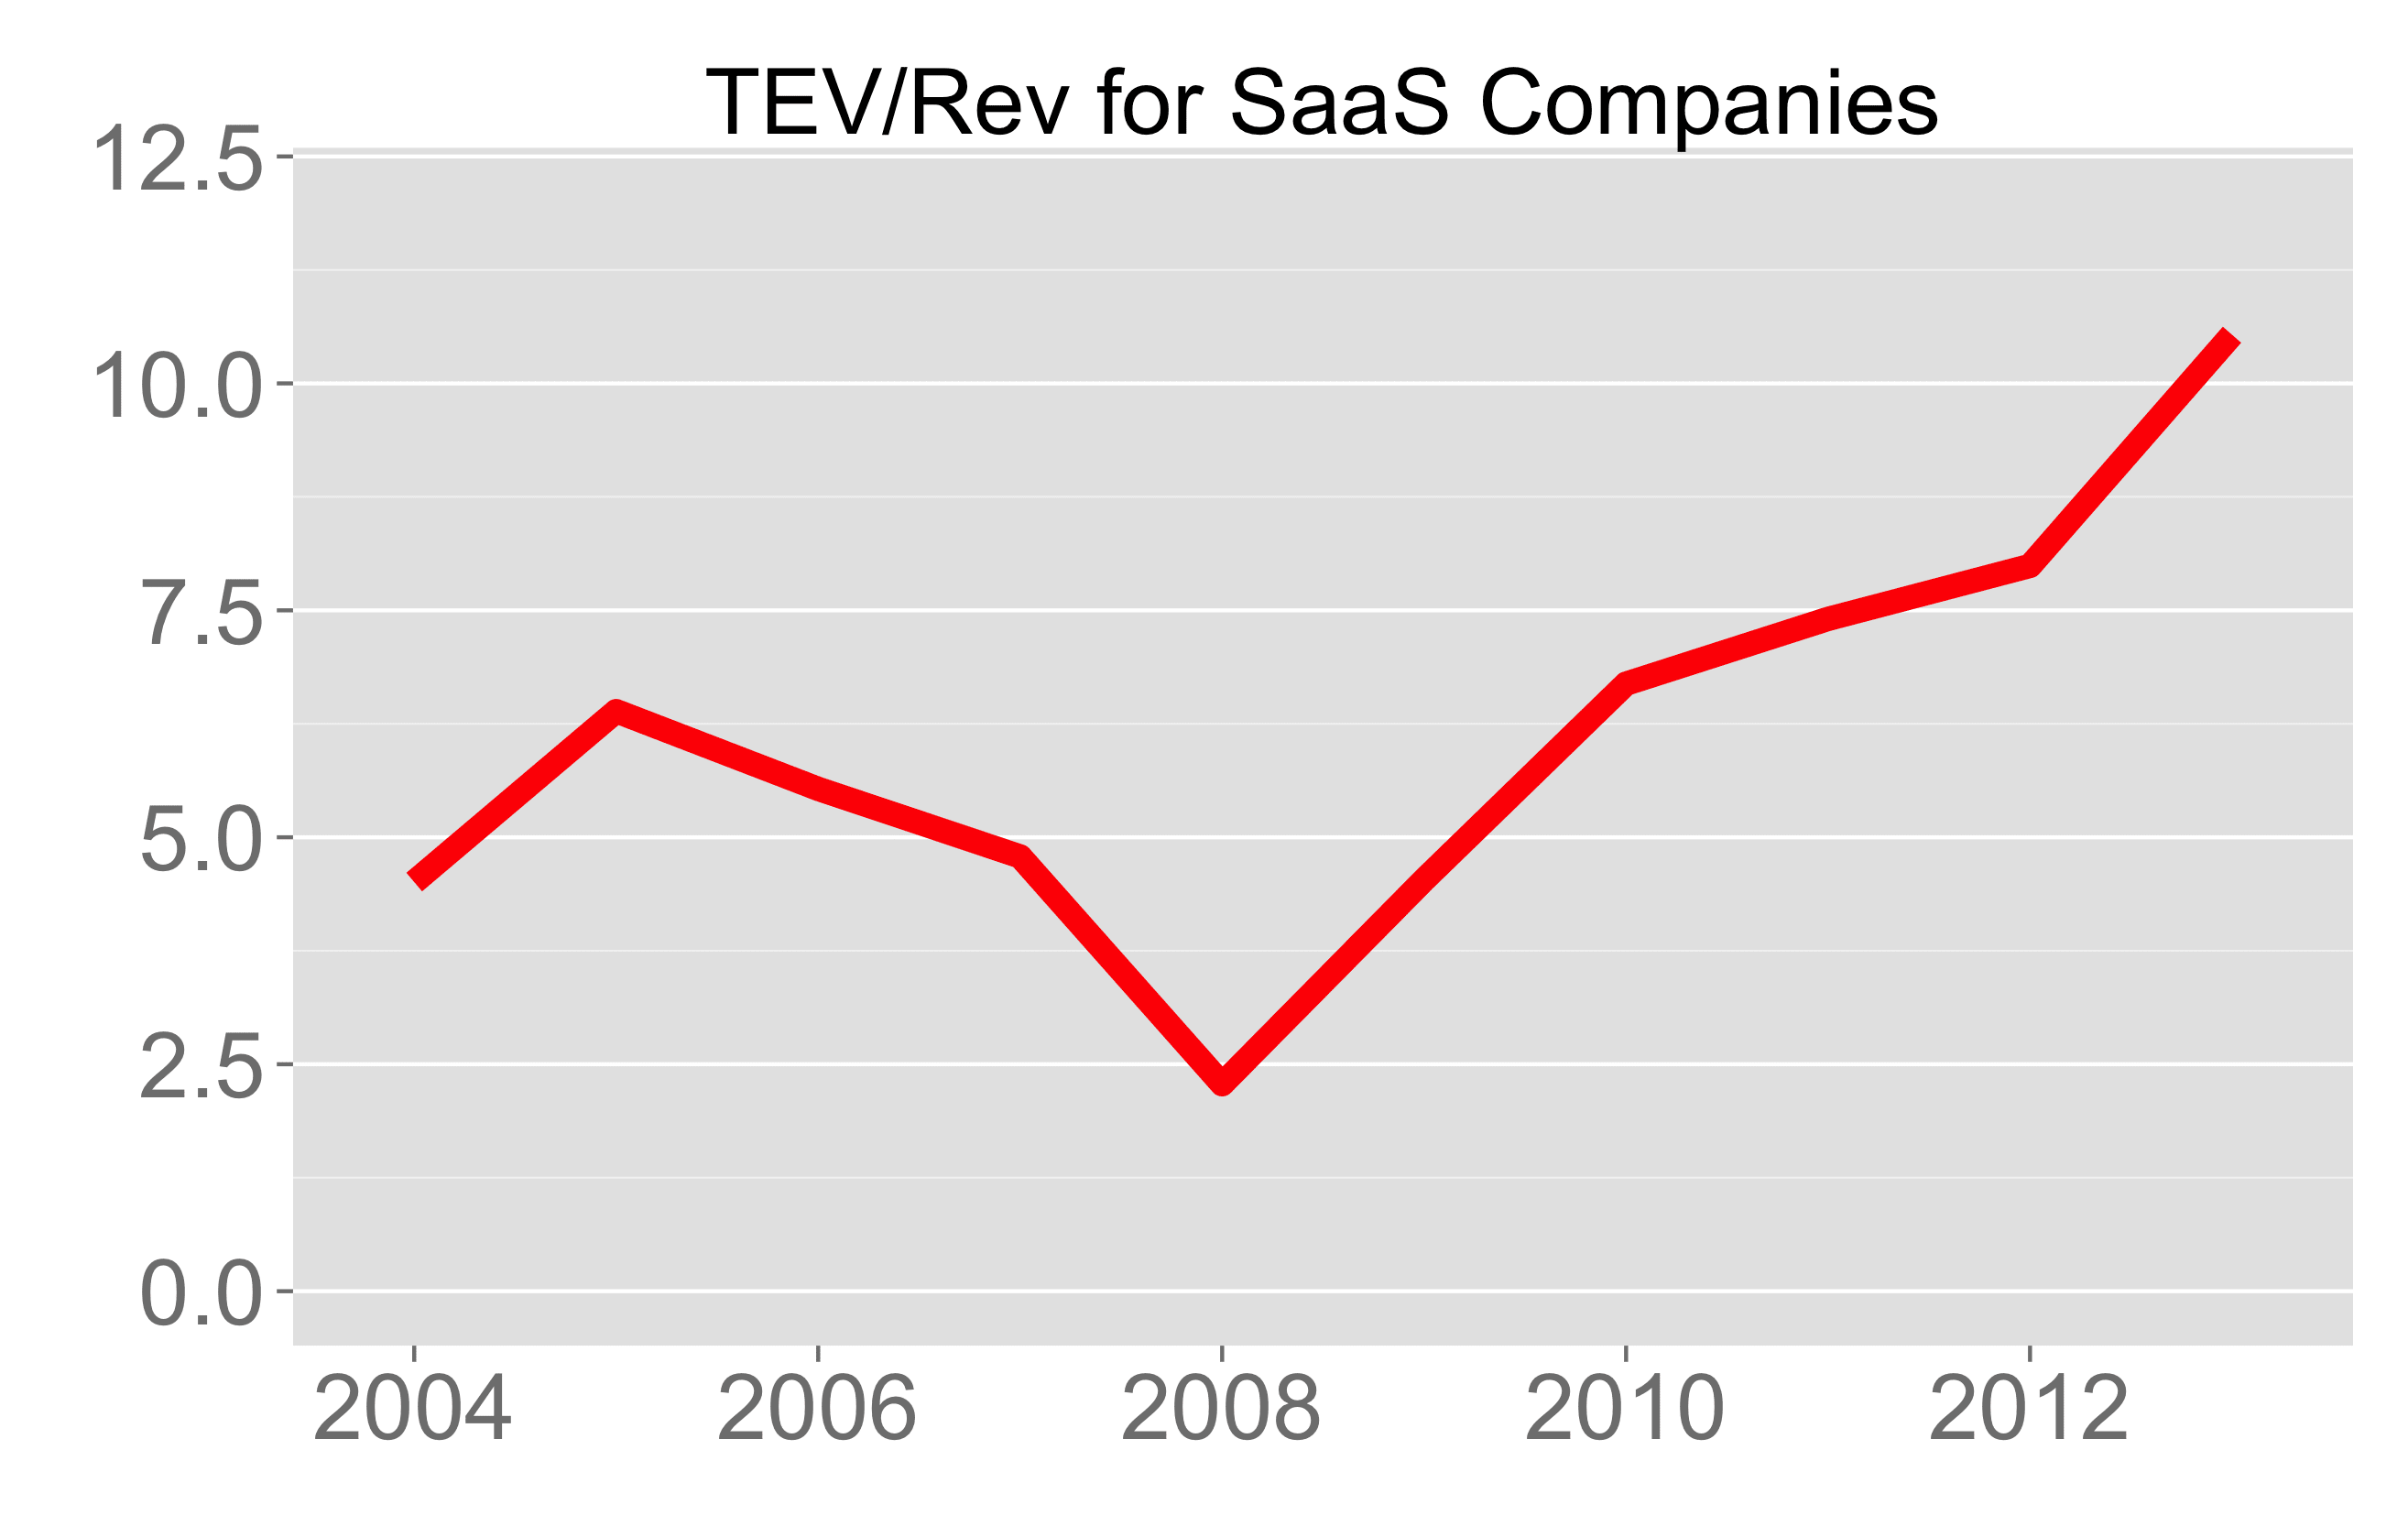
Discover why SaaS companies now trade at 11x revenue vs 6x in 2006, with IPO timelines dropping from 12 to 7 years. Key data trends for startup founders.
Discover which tech giants pay most for startup acquisitions. Analysis of 15+ years of M&A data reveals surprising patterns between Google, Facebook, Apple & Amazon.
Analyze 3 key startup exit trends: 7% annual value growth, flat exit volume, and 2x increase in IPOs. Data-driven insights from 10 years of venture capital exits.
Data analysis reveals tech company valuations dropped 67% since 1980s, from $4.3B to $1.4B, as market fragmentation reshapes the industry landscape.
Explore how the $9.7T tech market is becoming more fragmented, with top 10 companies' share dropping from 95% to 26% - a positive signal for startups.
Discover the true costs of taking your startup public. New data shows tech IPOs pay 8.8% in fees on average, with detailed breakdowns across 360 VC-backed companies.
Analysis of 2400 tech startup acquisitions reveals 83% are all-cash deals, with larger $1B+ exits more likely to include stock. Key M&A patterns for founders and investors.
Discover the cash requirements for tech IPOs: median startups burn $33M and need $32M in reserves. Data from 2013 IPOs reveals 4 distinct spending patterns.
Discover why growth rate explains 50% of startup IPO valuations in 2013, while profitability shows zero correlation. Data analysis of 25 tech IPOs reveals key trends.
Explore how operating margins impact startup acquisition prices and why high-margin businesses may command premium valuations in M&A deals. Key insights for founders.