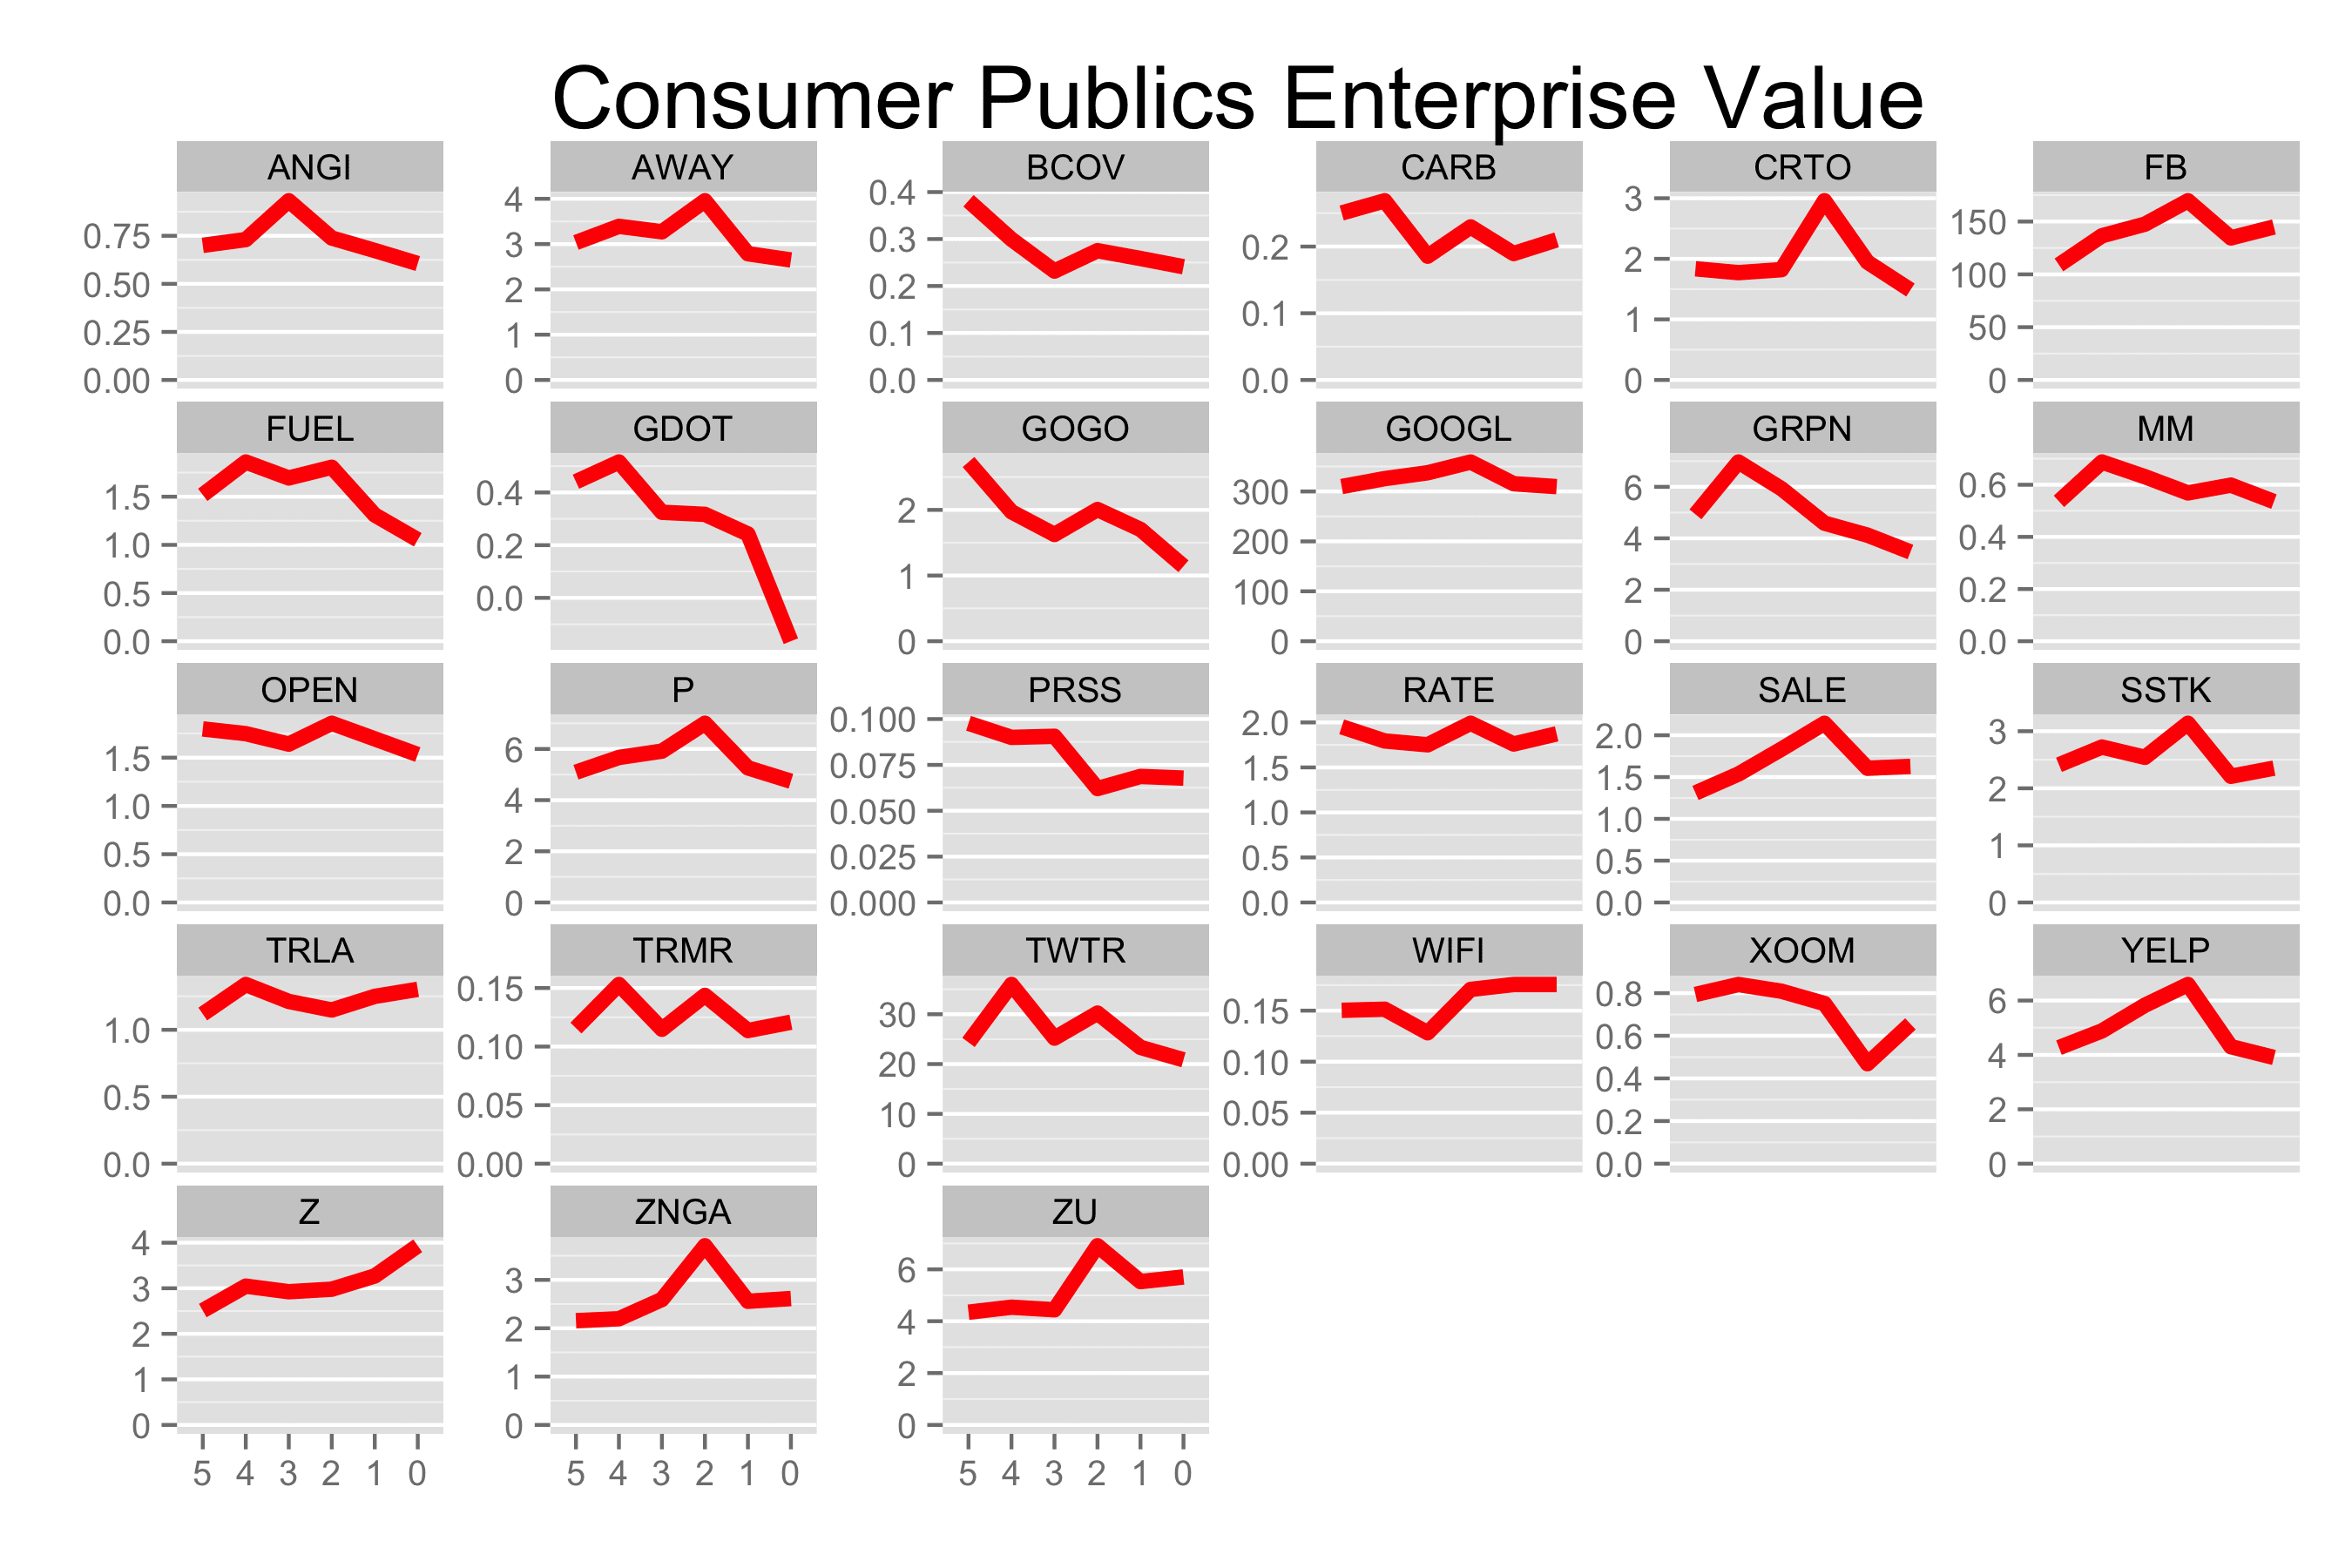
The Current State of the Consumer Internet Market
Analysis of consumer internet stocks shows 25% average decline, with social media up while fintech struggles. Key data on post-2010 tech IPO performance trends.
SaaS company valuations plummet 33% from peak, erasing a year of gains. Analysis shows $33B enterprise value drop across public SaaS stocks in 10 months.
Explore how modern SaaS startups achieve 2x revenue-on-invested-capital vs 1998, with data showing increased capital efficiency for venture-backed companies.
Analyze financing data from 41 public SaaS companies: from $4M to $400M raised pre-IPO. Key insights on capital efficiency and growth paths in modern cloud startups.
Discover why Series B is now the toughest funding round for startups, with data showing 31% growth in Series A vs just 10% in Series B rounds since 2009.
Analyze the rise of mega-funding rounds in tech startups with data-driven insights from 2005-2013. Are $150M+ investments becoming the new normal?
Discover the optimal monthly growth rate SaaS startups need to raise Series A funding, backed by real metrics and VC insights. Data-driven analysis for founders.
Discover the revenue milestones SaaS startups need to hit for IPO success. Data from 41 public companies shows median path from $11M to $100M+ revenue.
Discover why SaaS companies now trade at 11x revenue vs 6x in 2006, with IPO timelines dropping from 12 to 7 years. Key data trends for startup founders.
Analyze how 25% YoY startup growth impacts fundraising success across sectors. Data-driven insights on competition trends in enterprise, web, and mobile verticals.