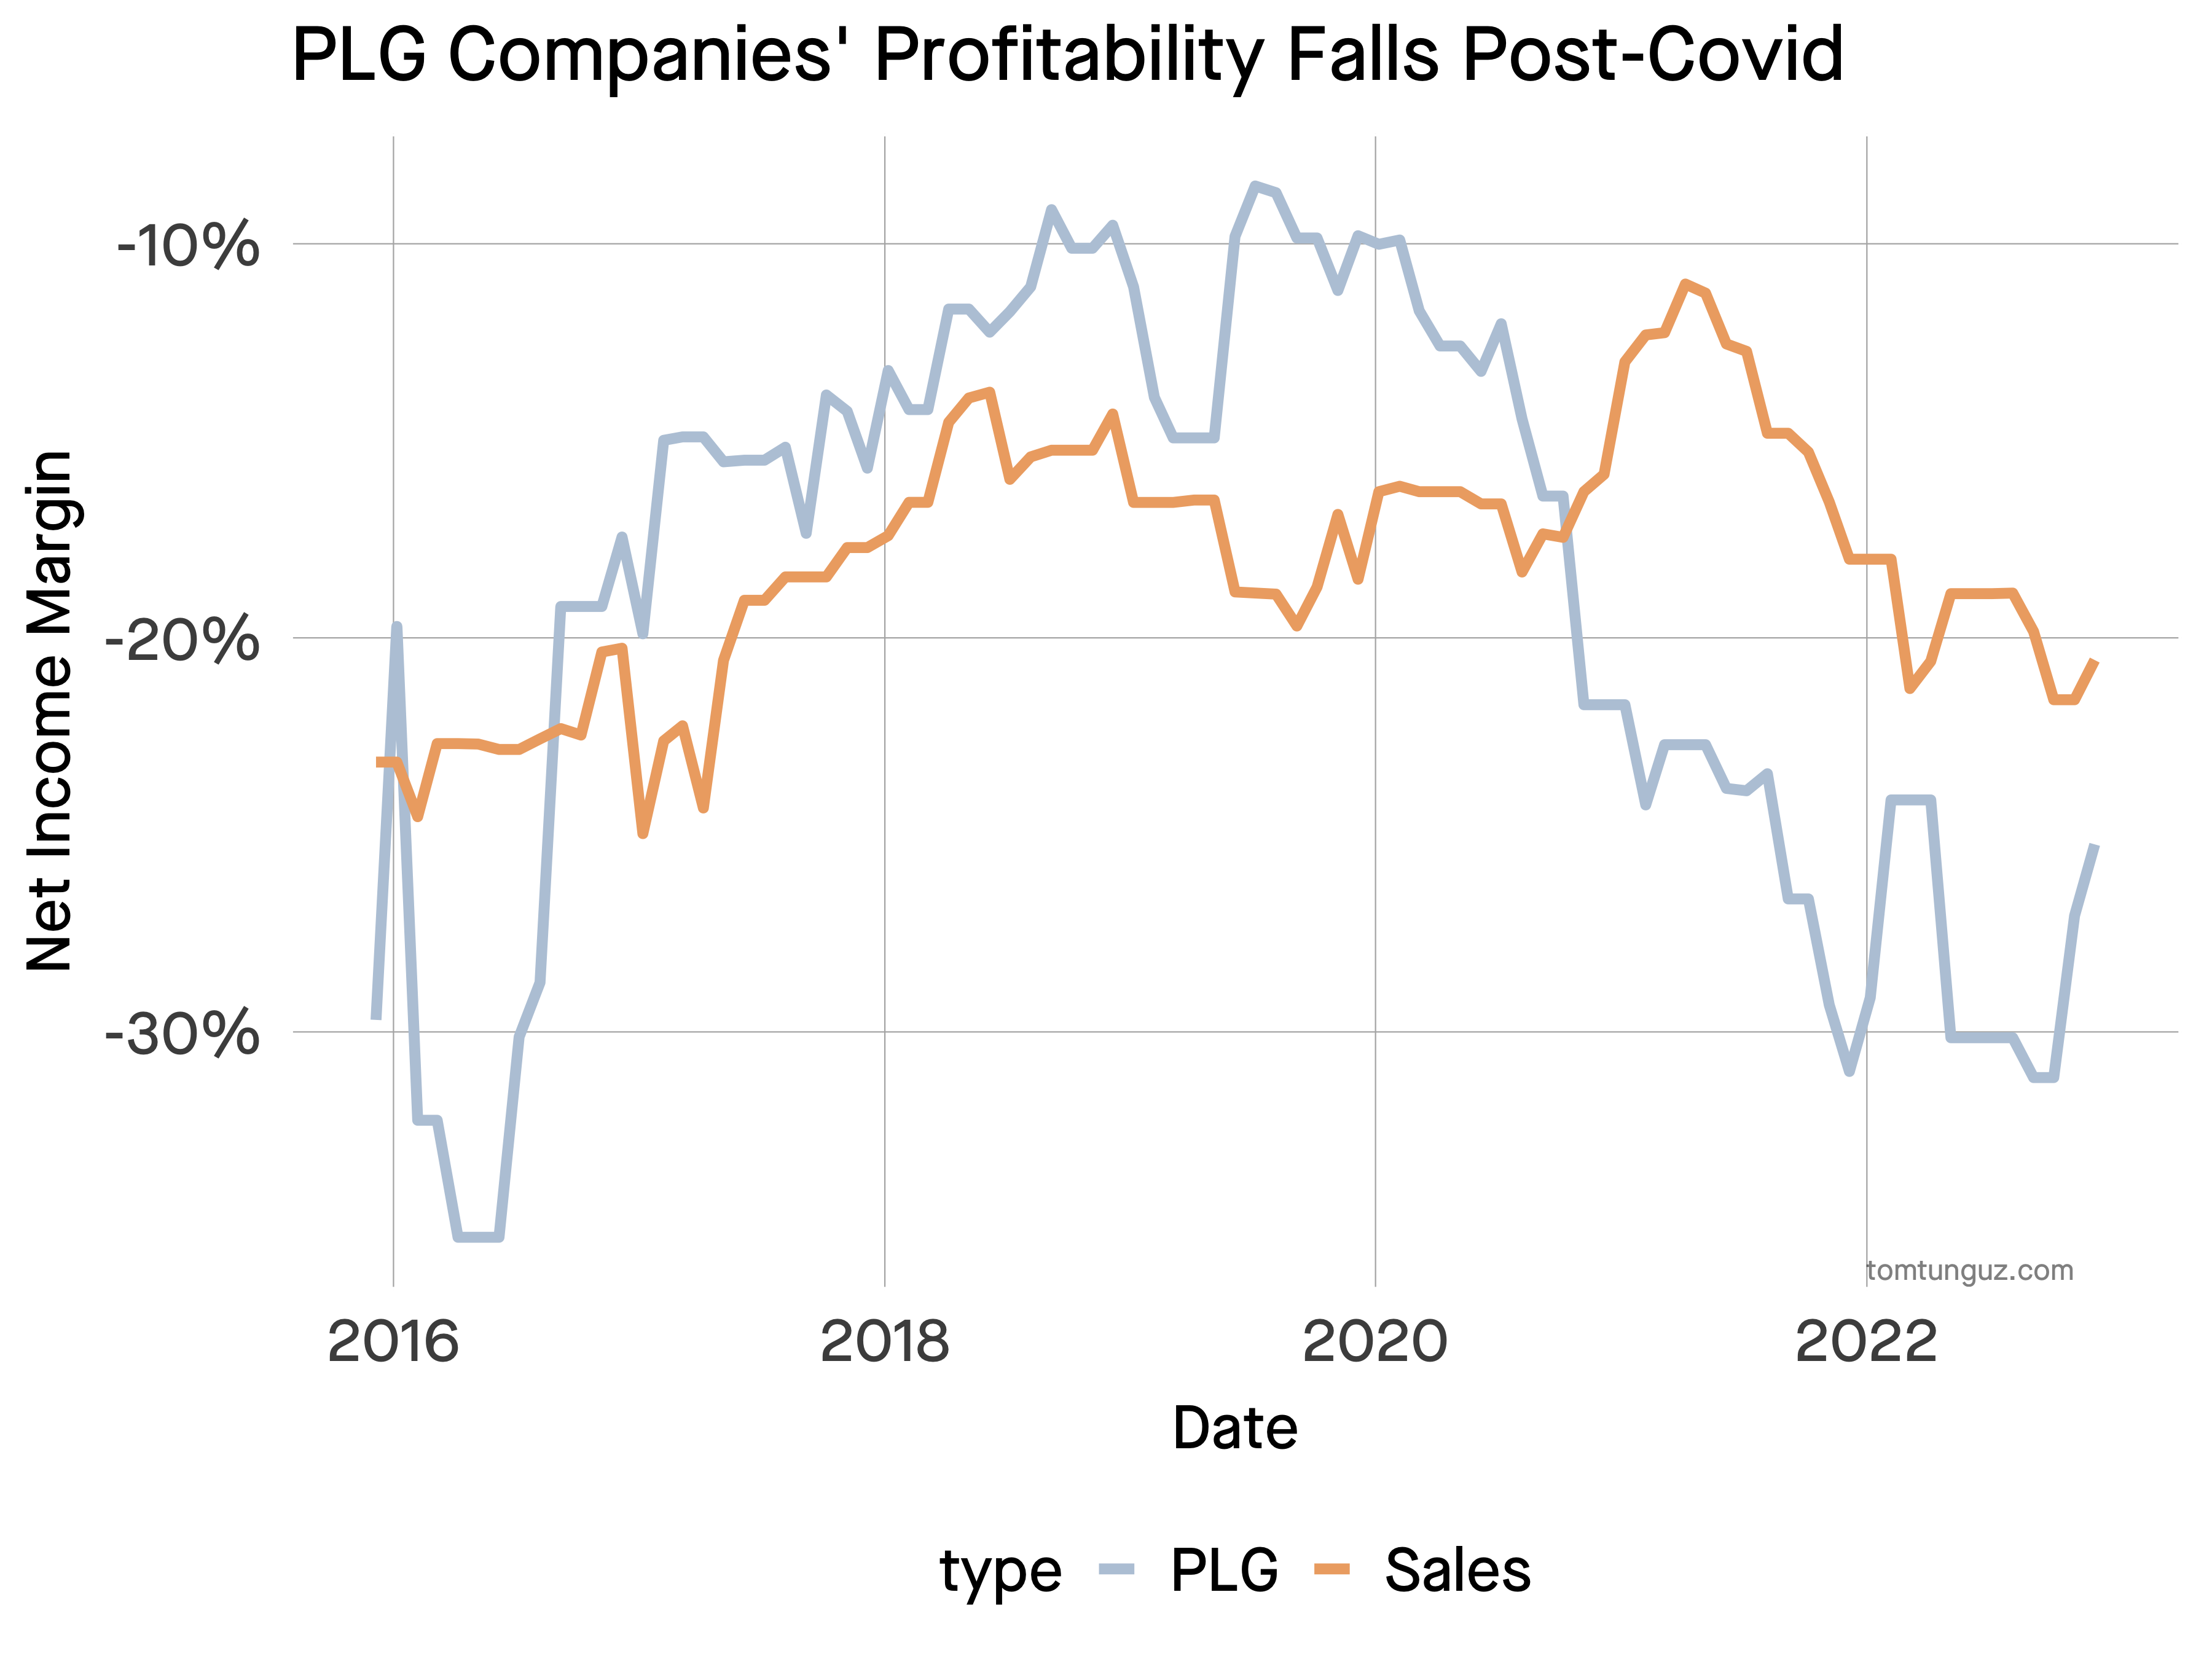
PLG & Profitability : More Product Doesn't Necessarily Mean Greater Profits
Profitability or net income margin has become the most important correlate to public software company valuations. But public companies are less profitable today than a year ago. Surprisingly, PLG companies’ profitability has suffered more than sales-led businesses.
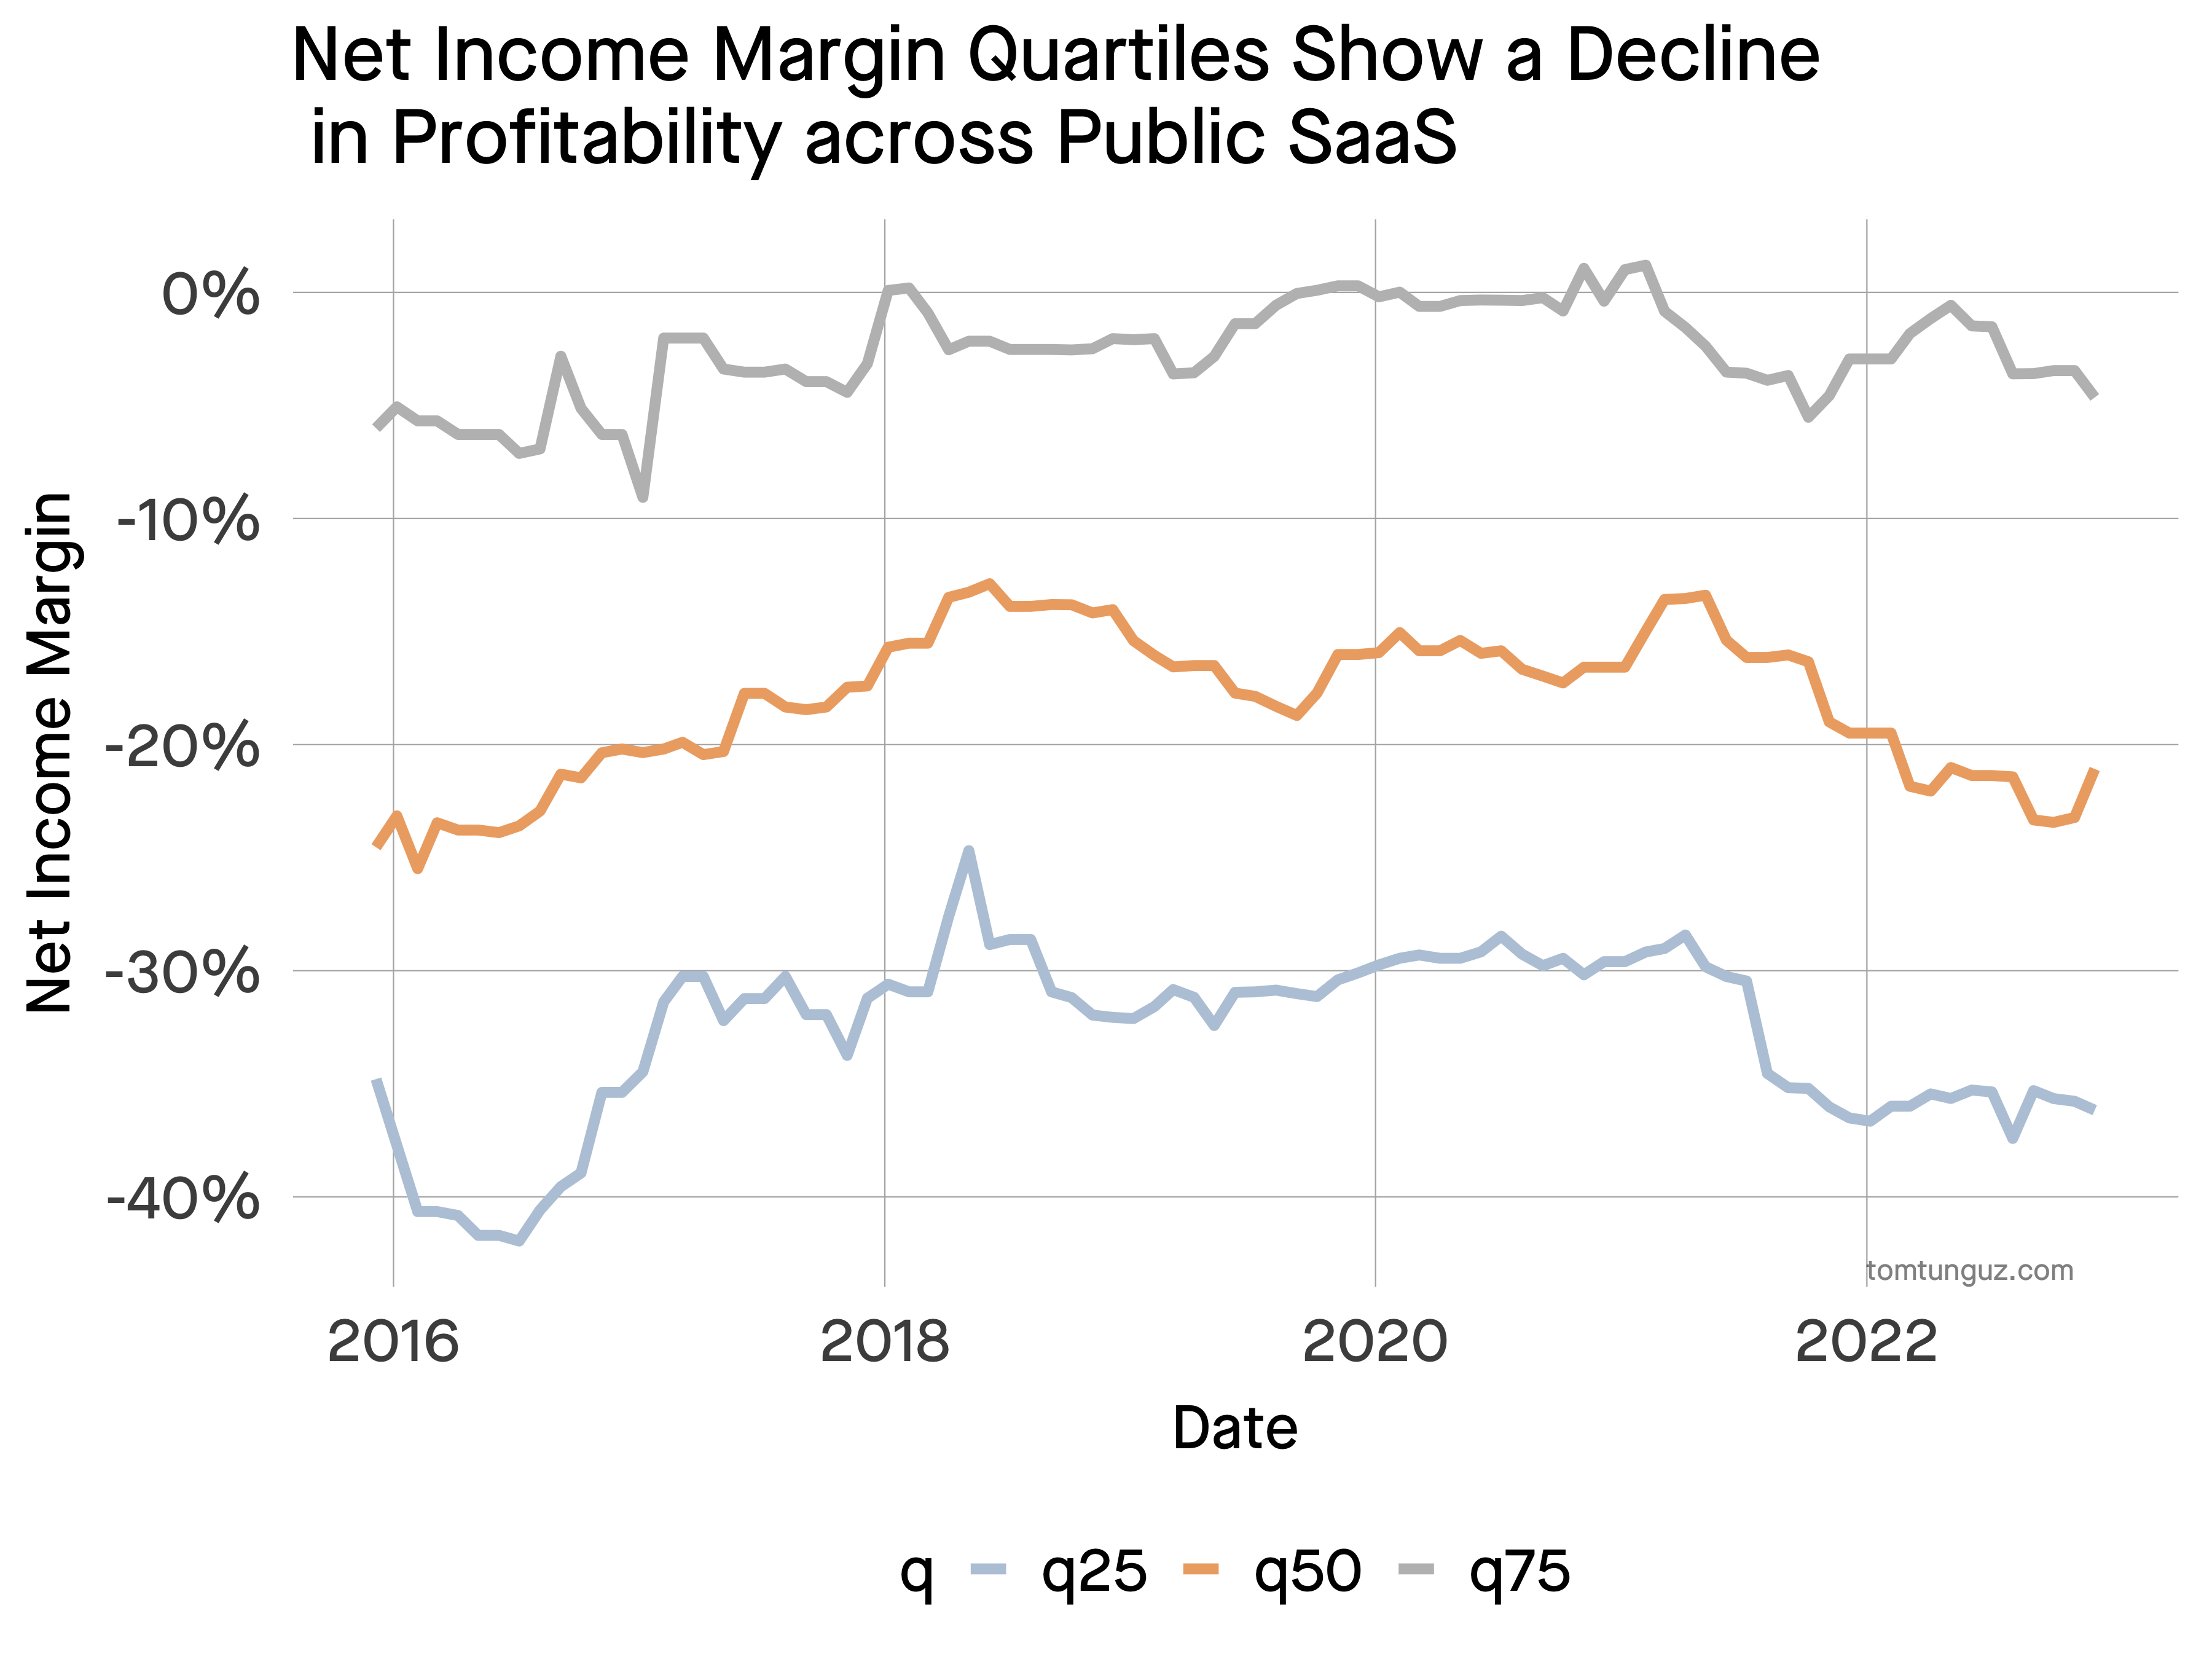
Across every quartile, public software & infrastructure companies have seen a 5 percentage point drop in net income since Covid.


 My laptop is faster than your cloud.
 On November 29th at 9am Pacific Time, Office Hours will host